Europe Week Visual Identity and website

Europe Week Visual Identity and website

Every year, the EU National Institutes for Culture organize a series of events in Brazil, celebrating European culture and providing an opportunity for Brazilians to engage with it. This initiative not only honors European heritage but also fosters cultural exchange and community among Europeans living in Brazil. Each year, the events revolve around a specific theme, with this year's focus being on the environment.

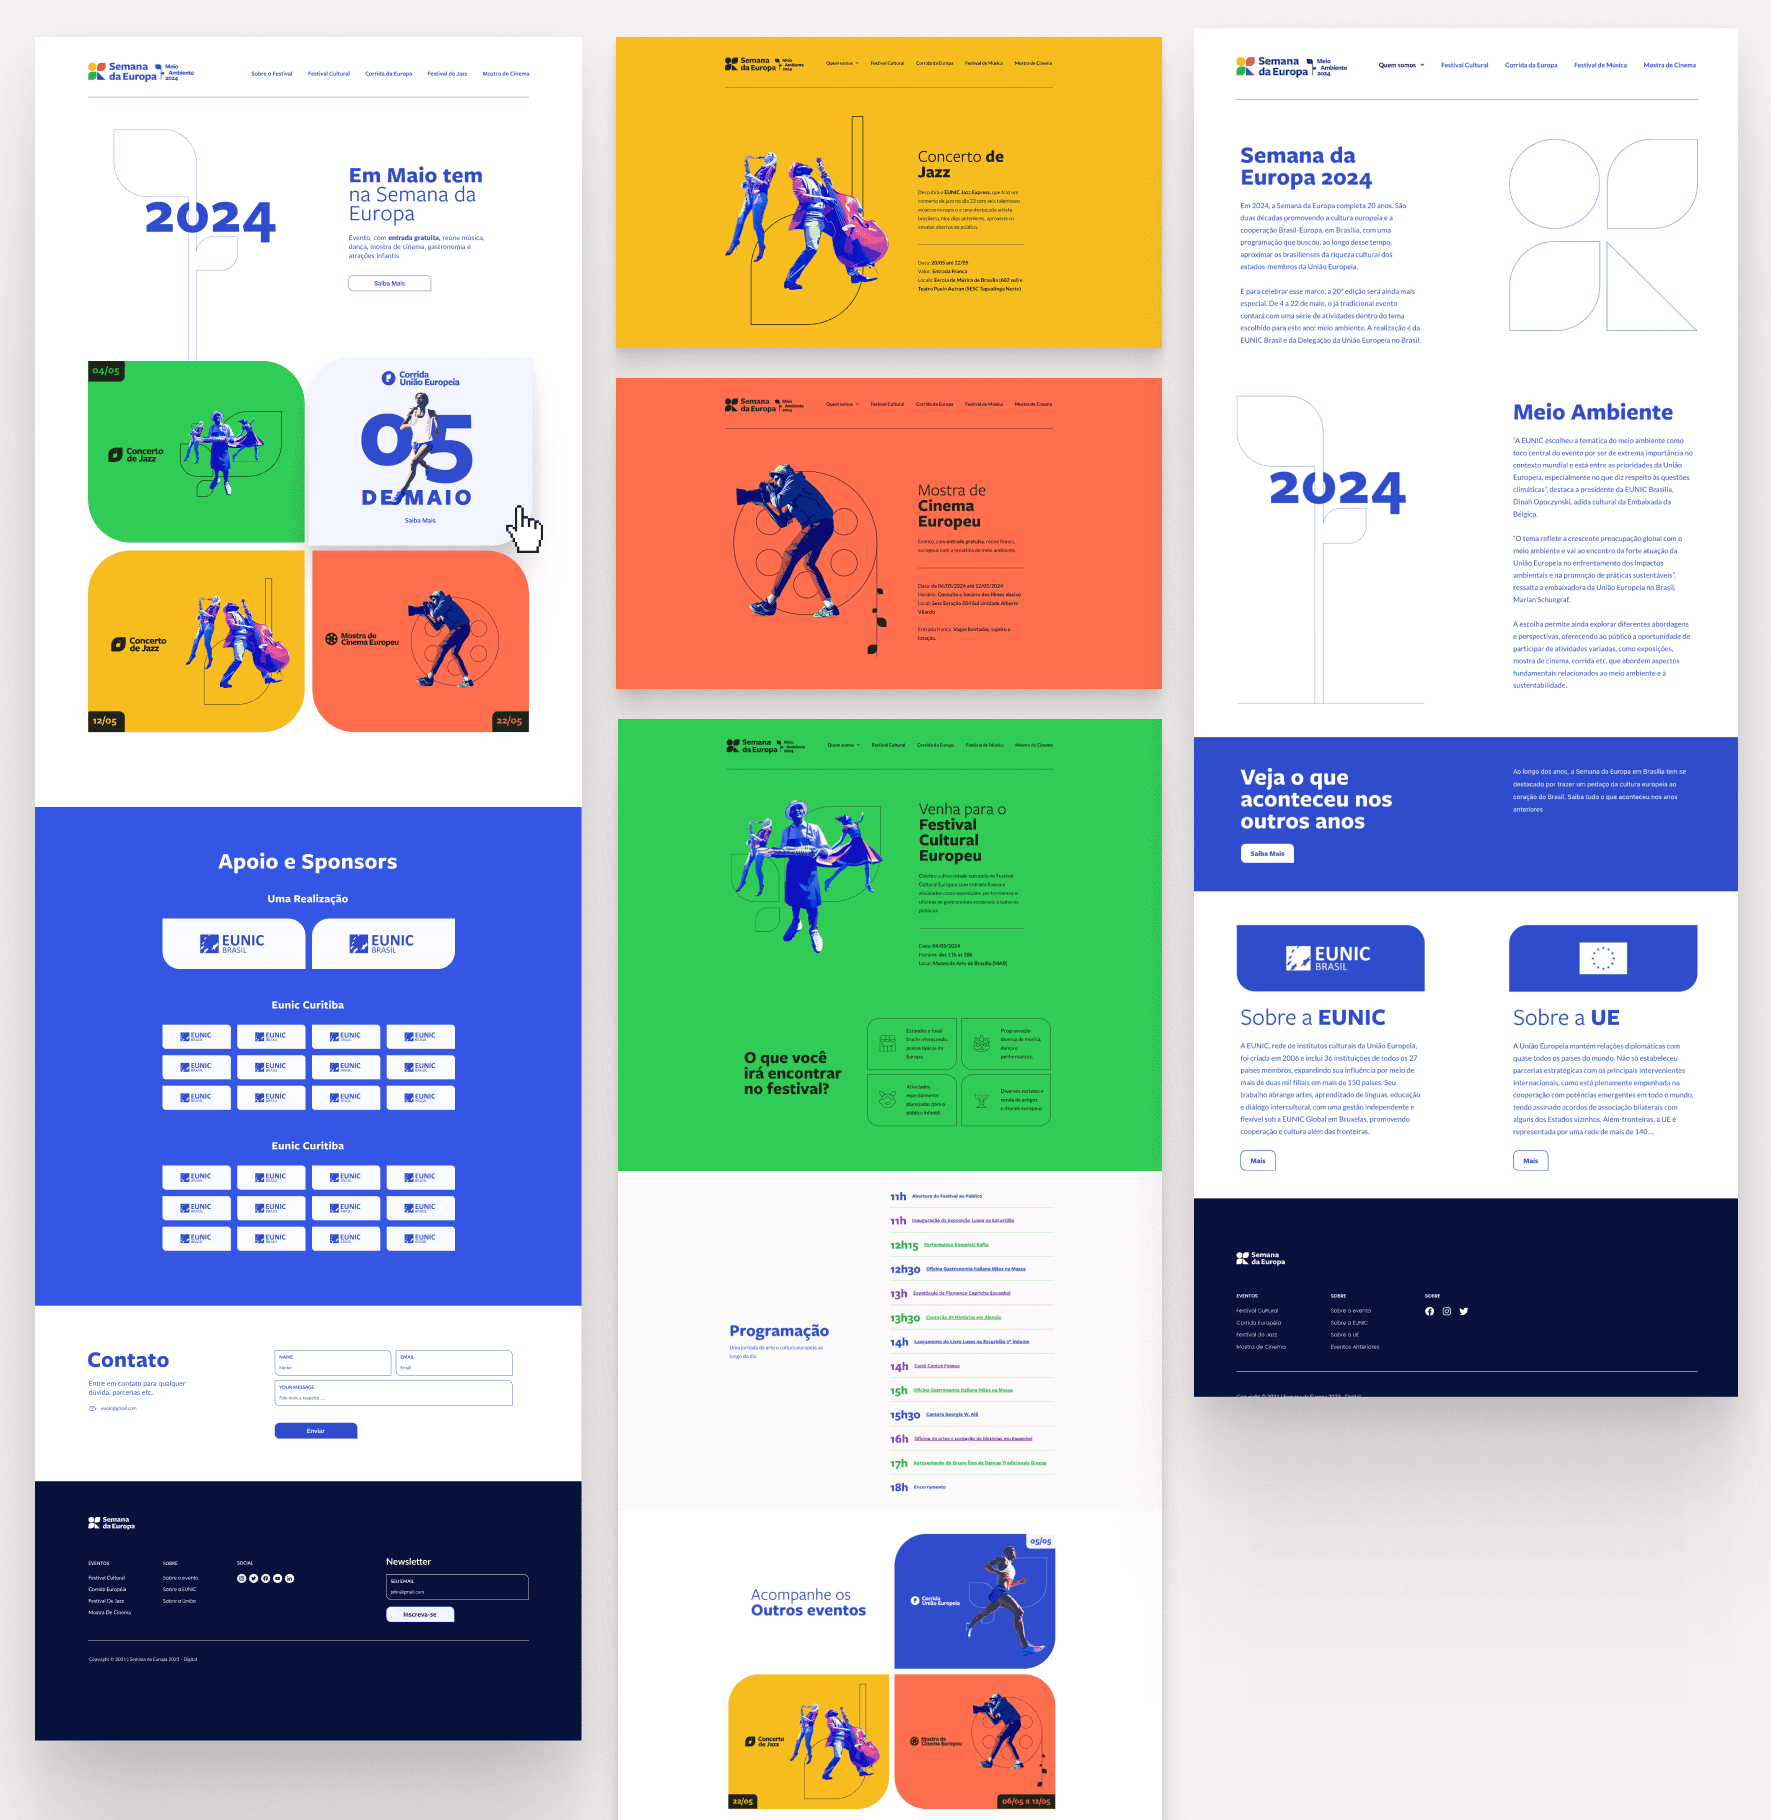
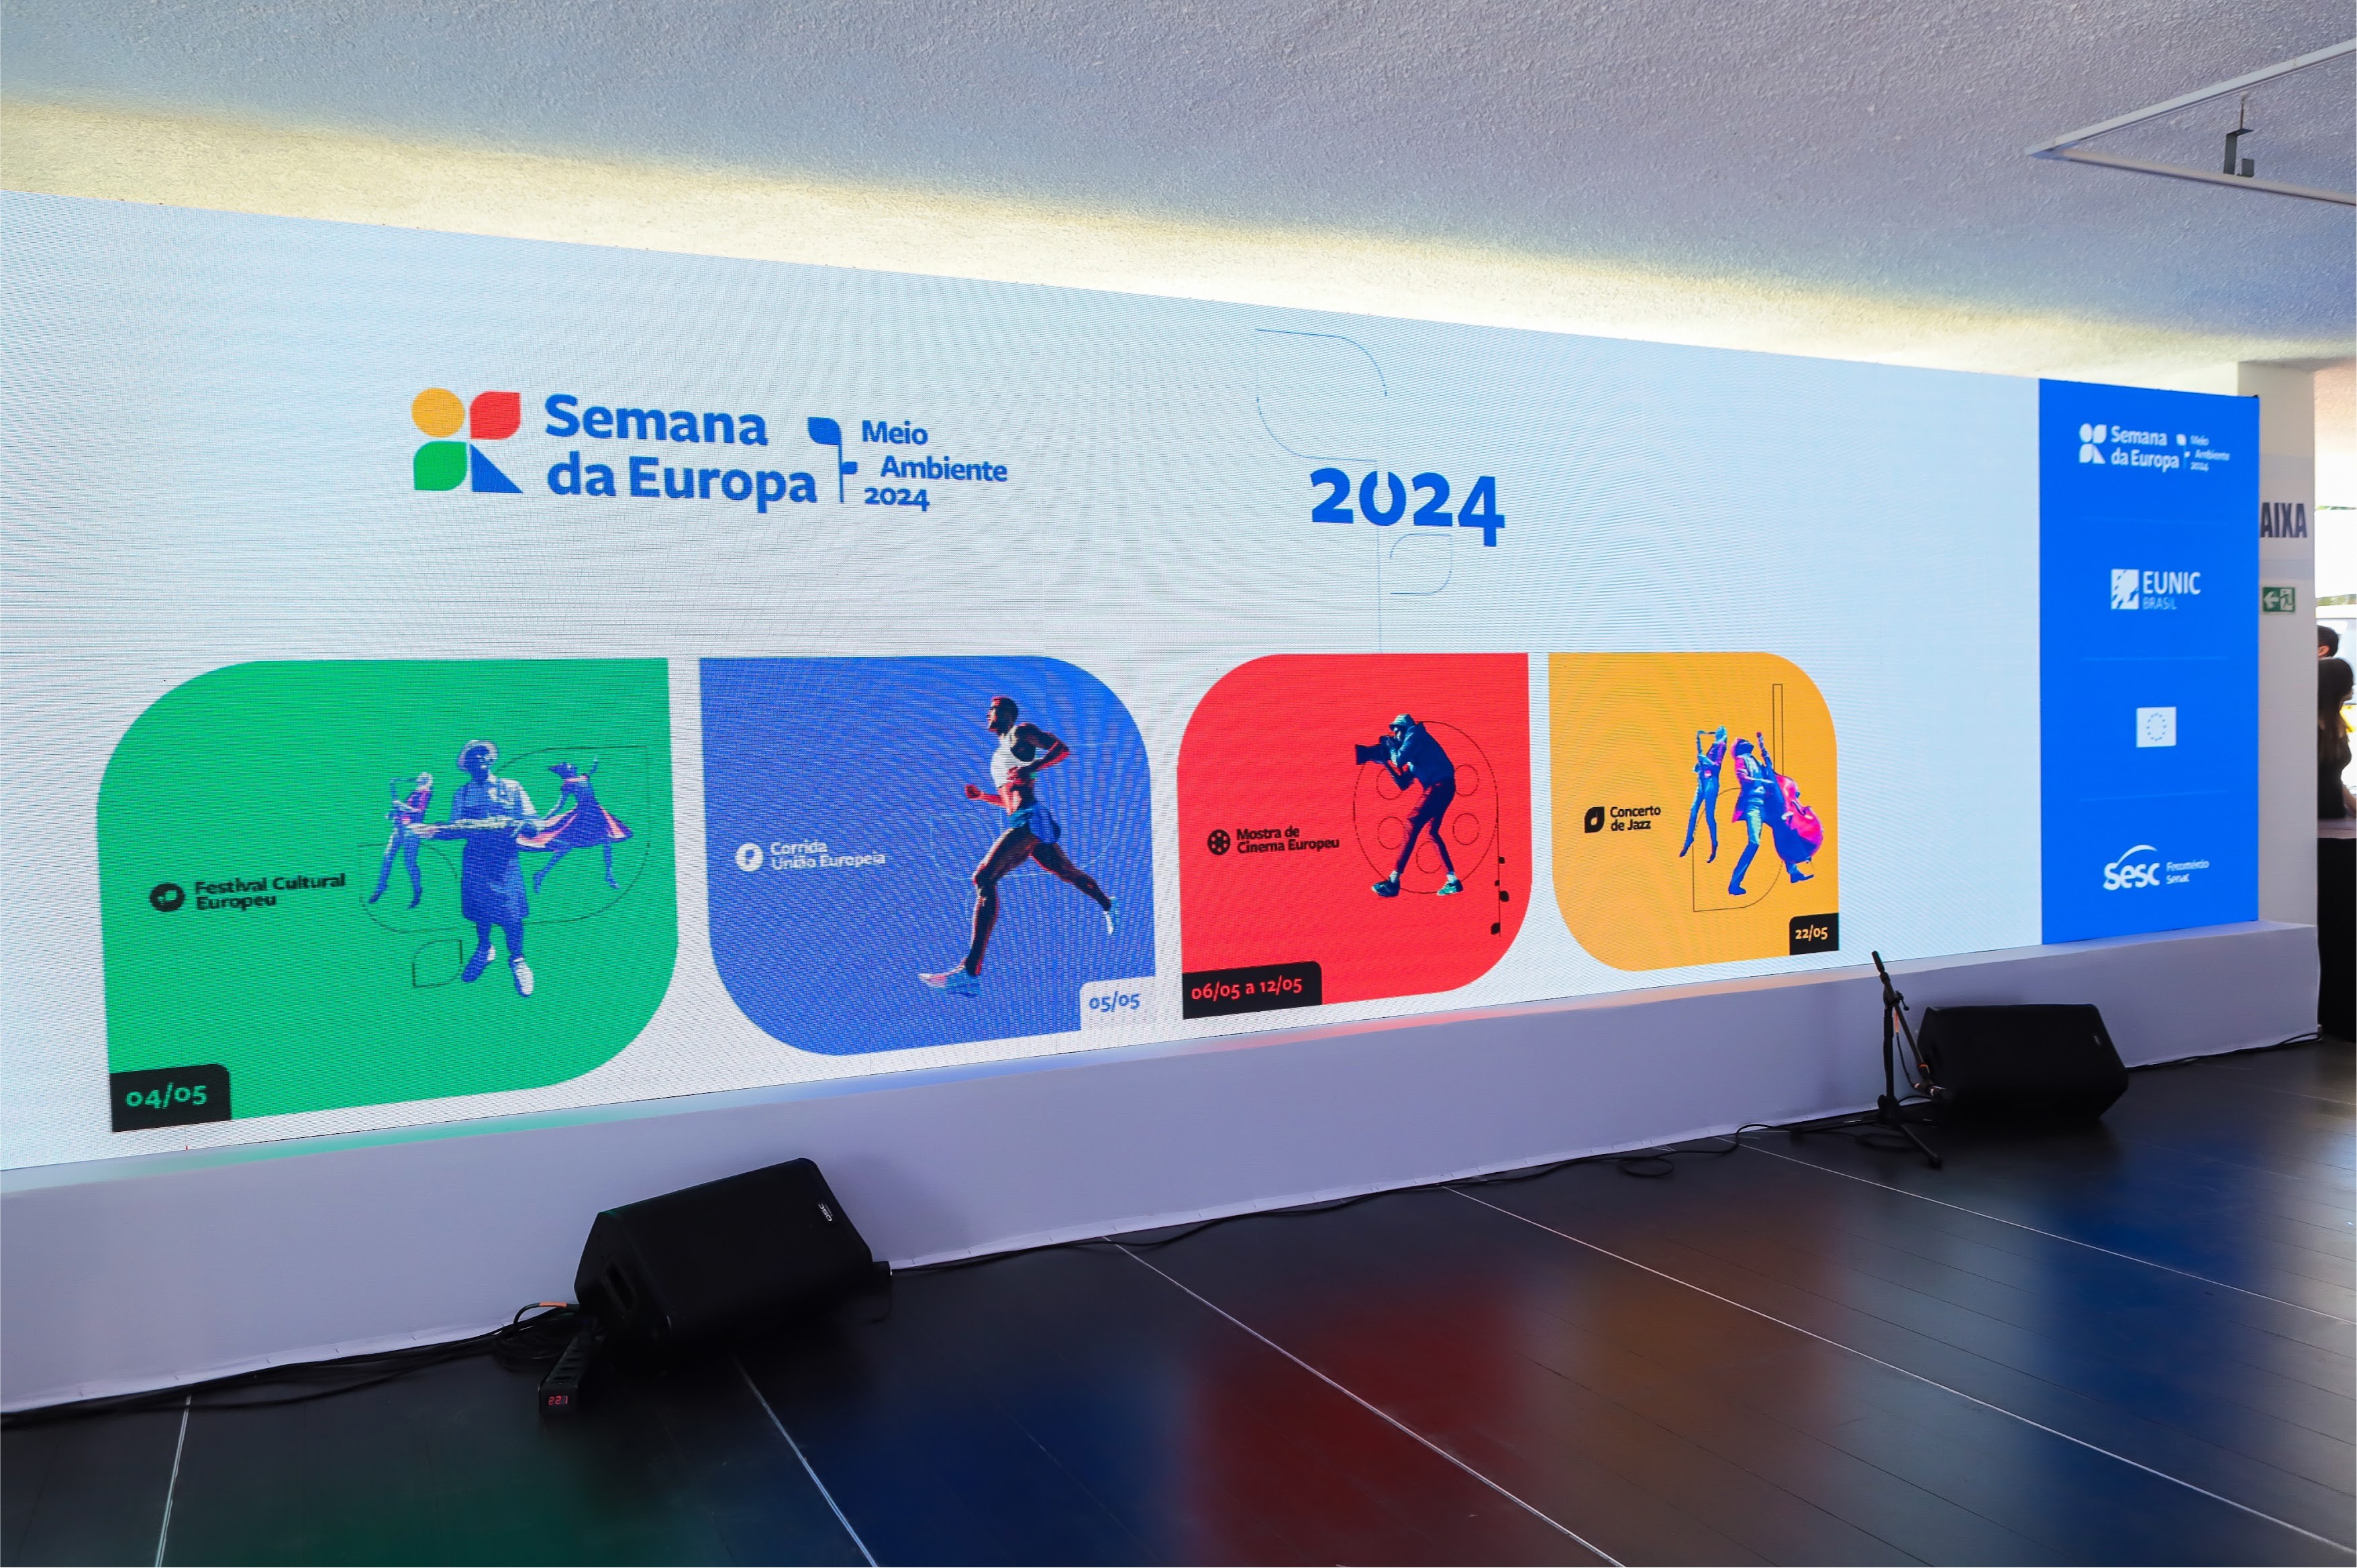
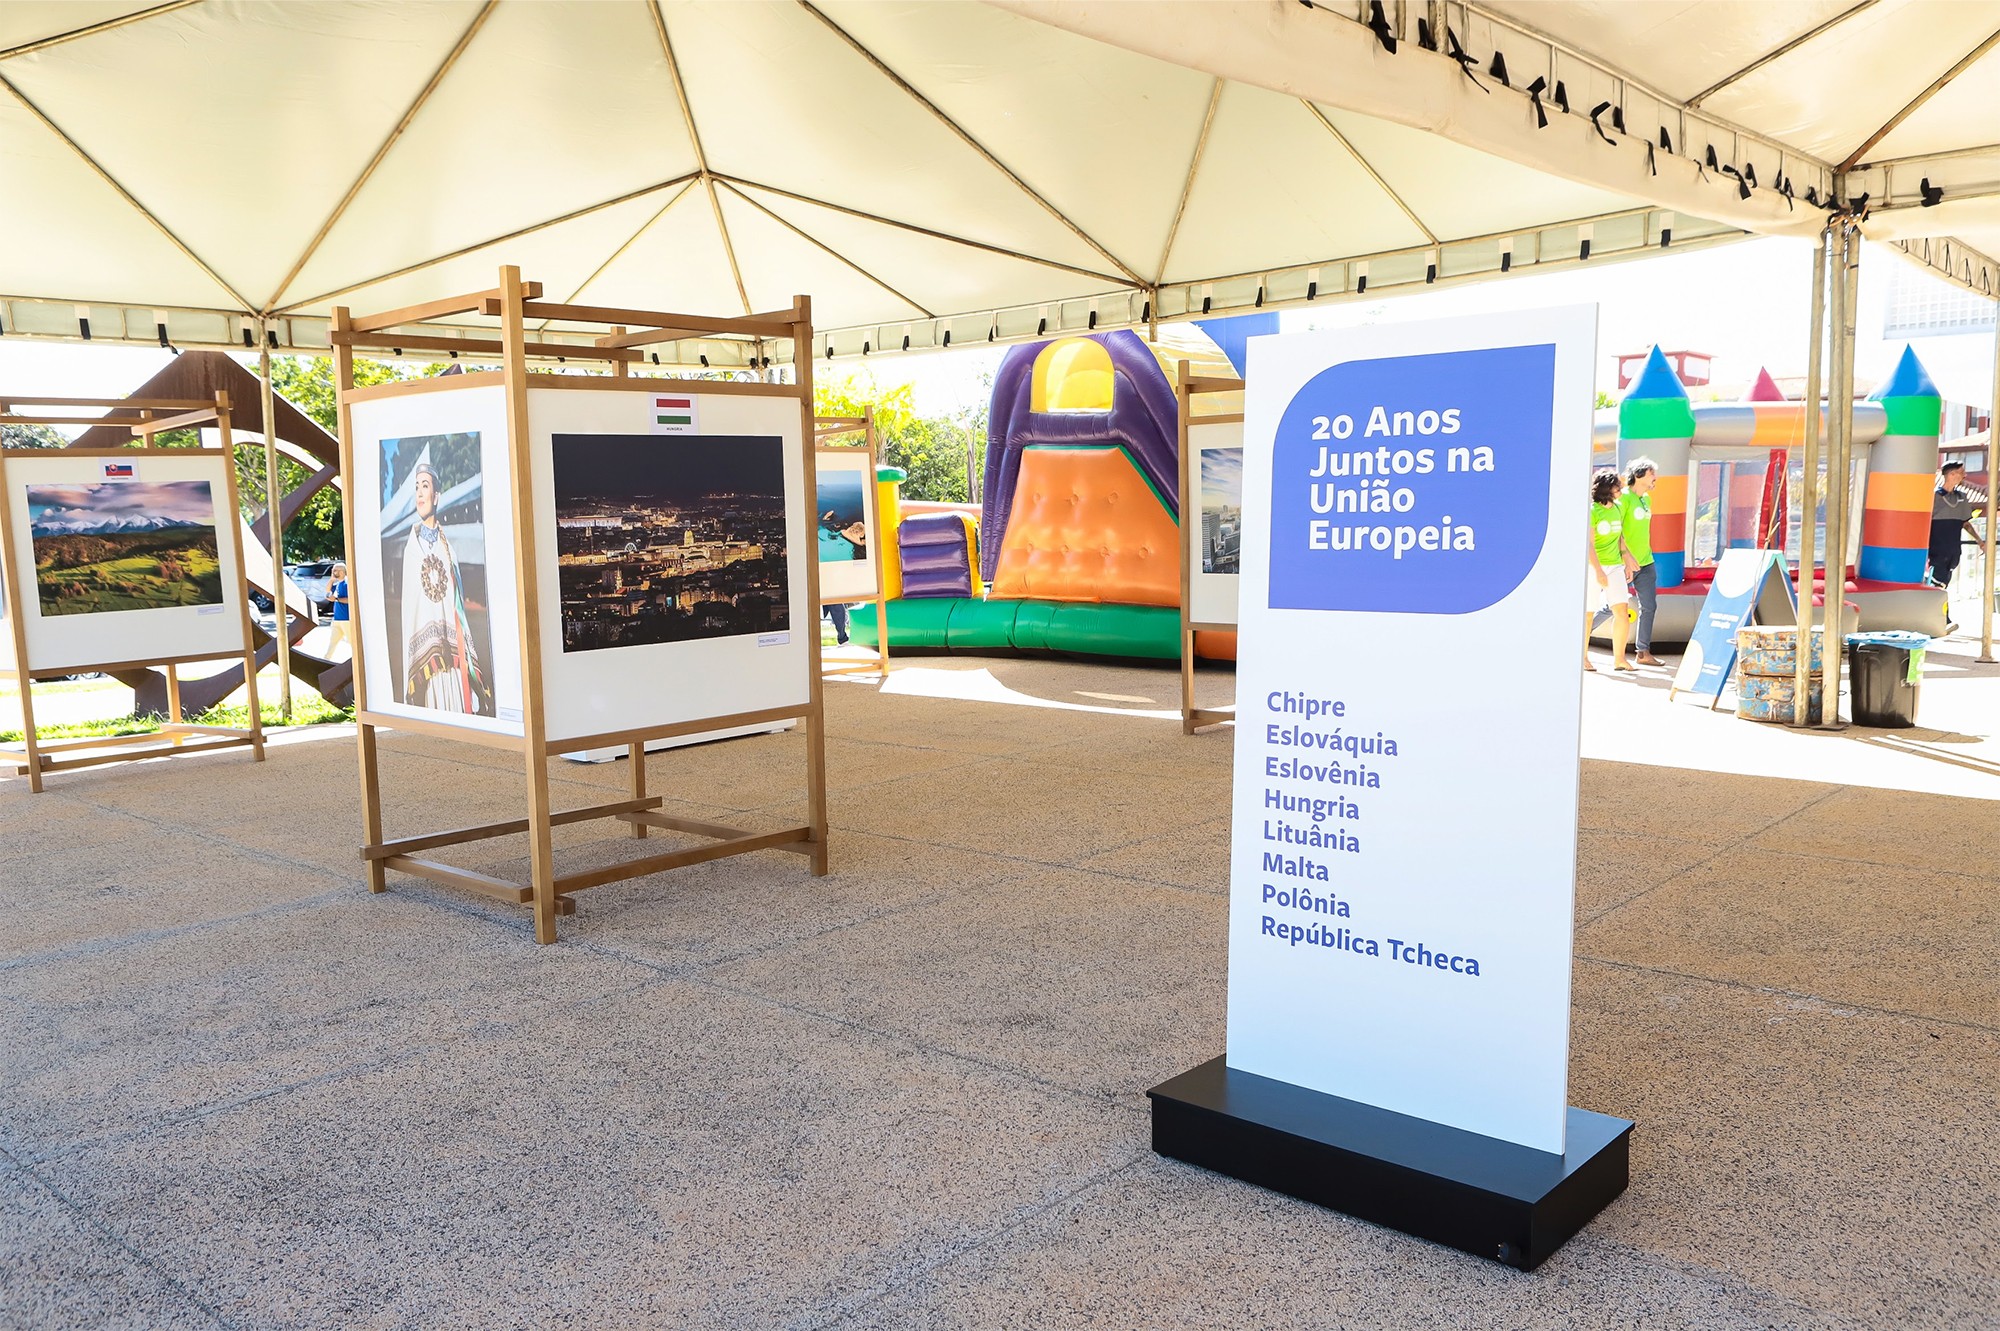
My challenge was to enhance their existing logo and visual identity, along with creating social media templates, event materials and the website.

Logo

Logo

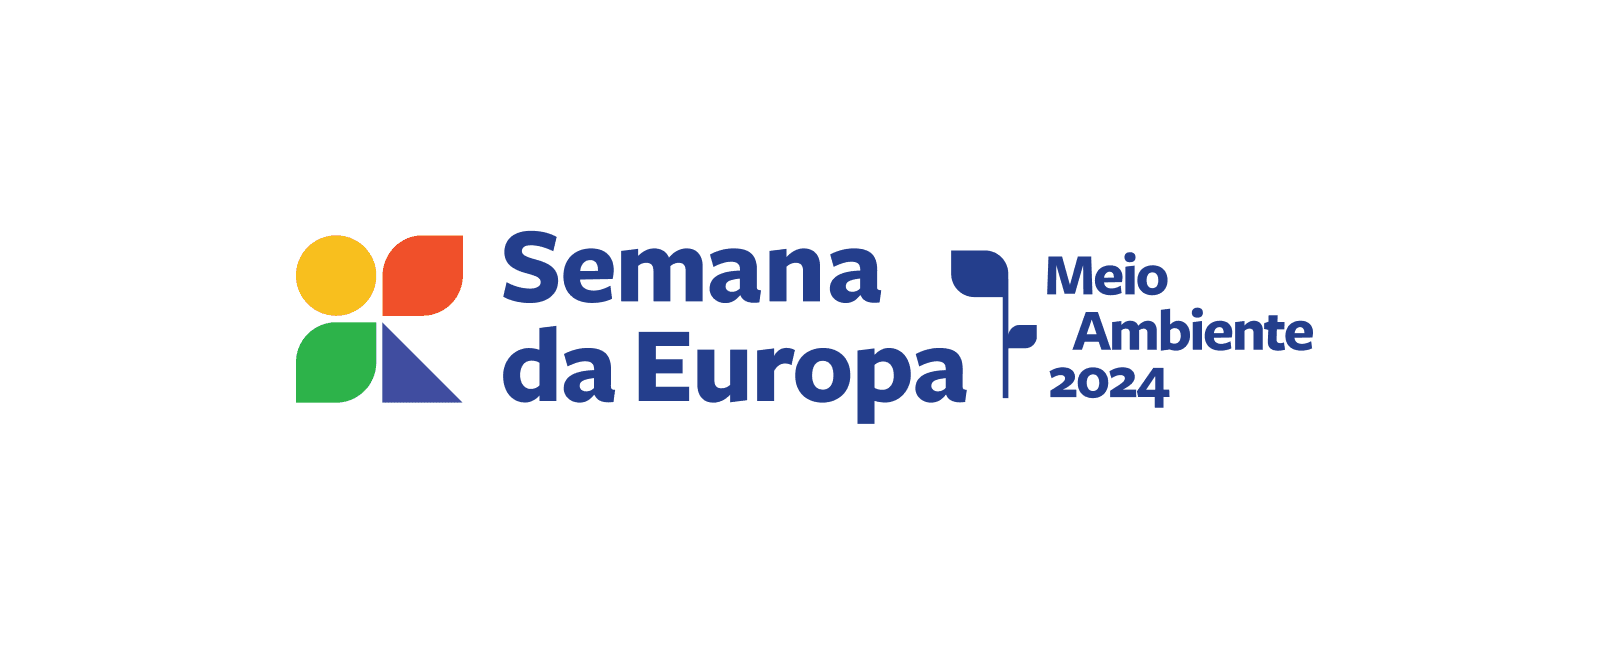
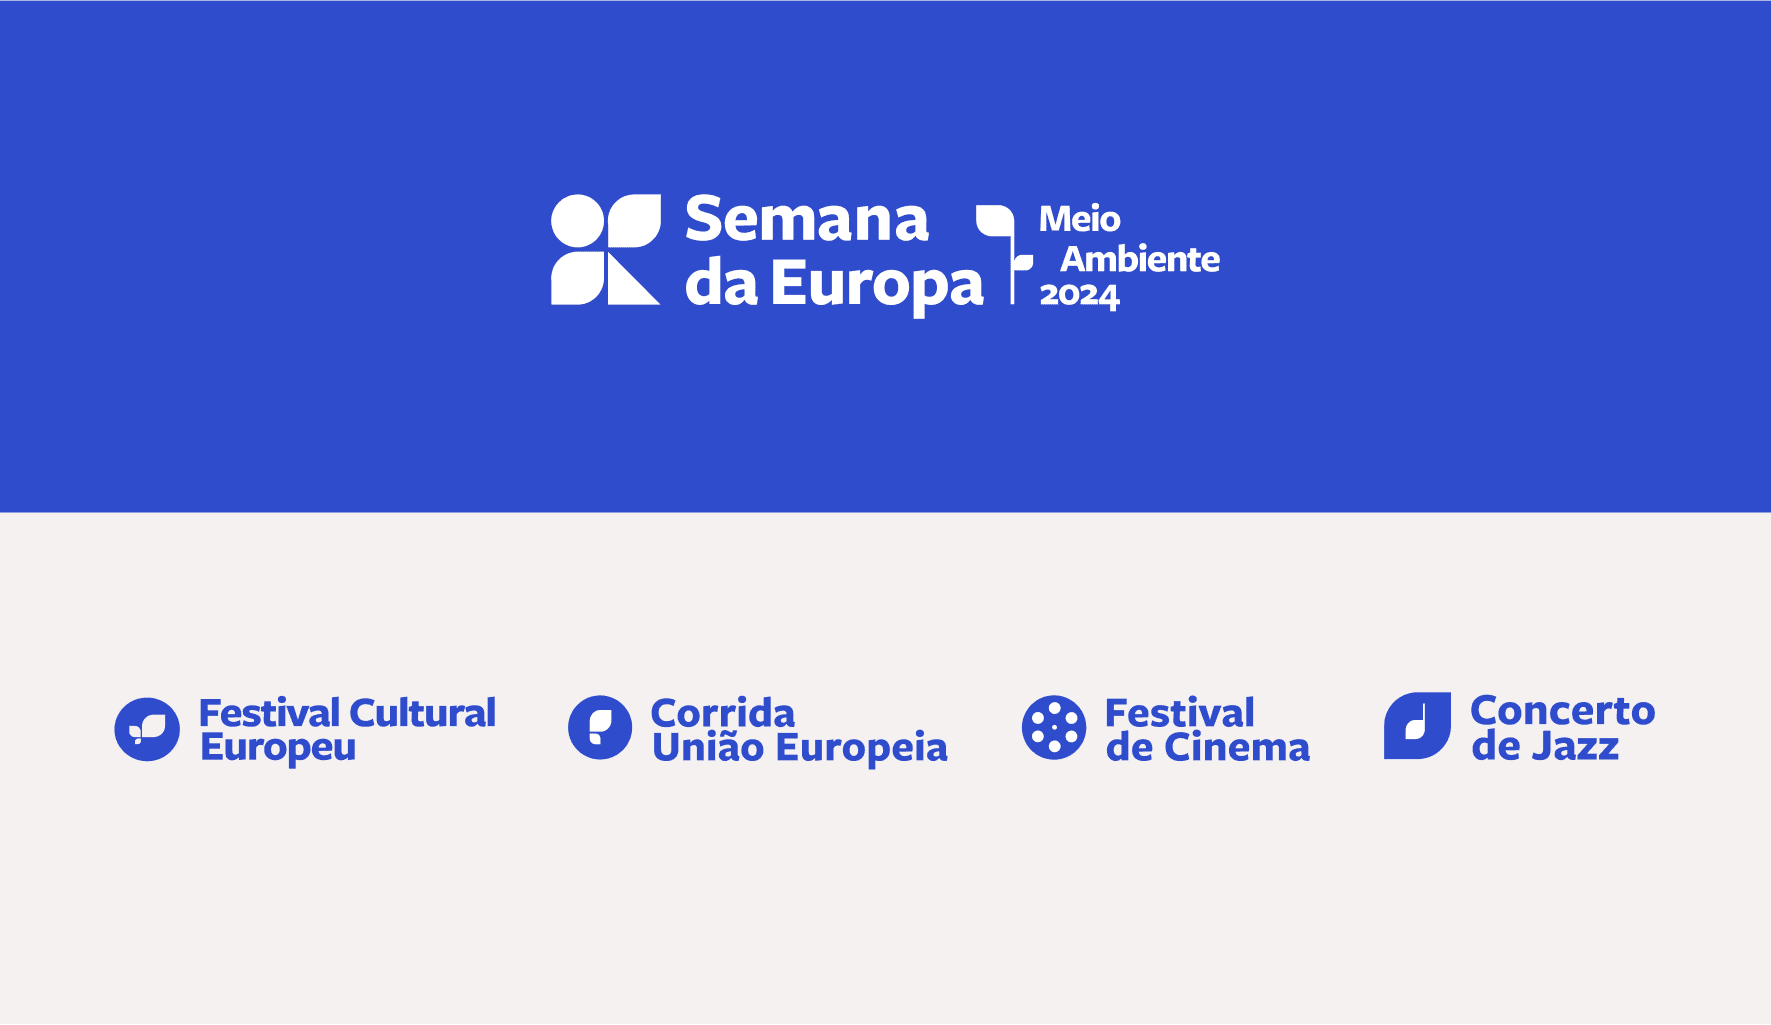
In this logo design for the theme "Environment," I utilized elements of the original logo to create a plant motif. The leaves, formed from the logo's shapes, add a dynamic quality to the design and visually guide the alignment of the text "Meio Ambiente 2024."

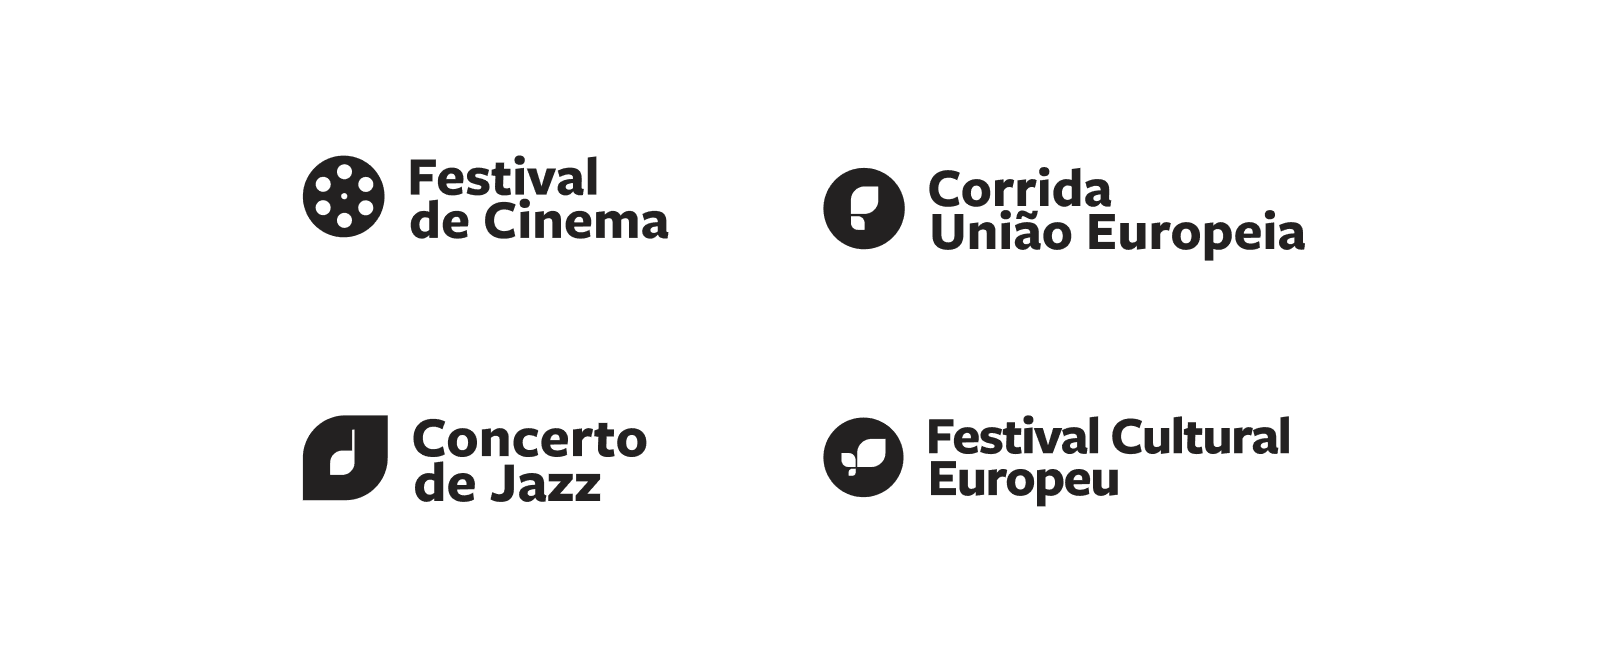
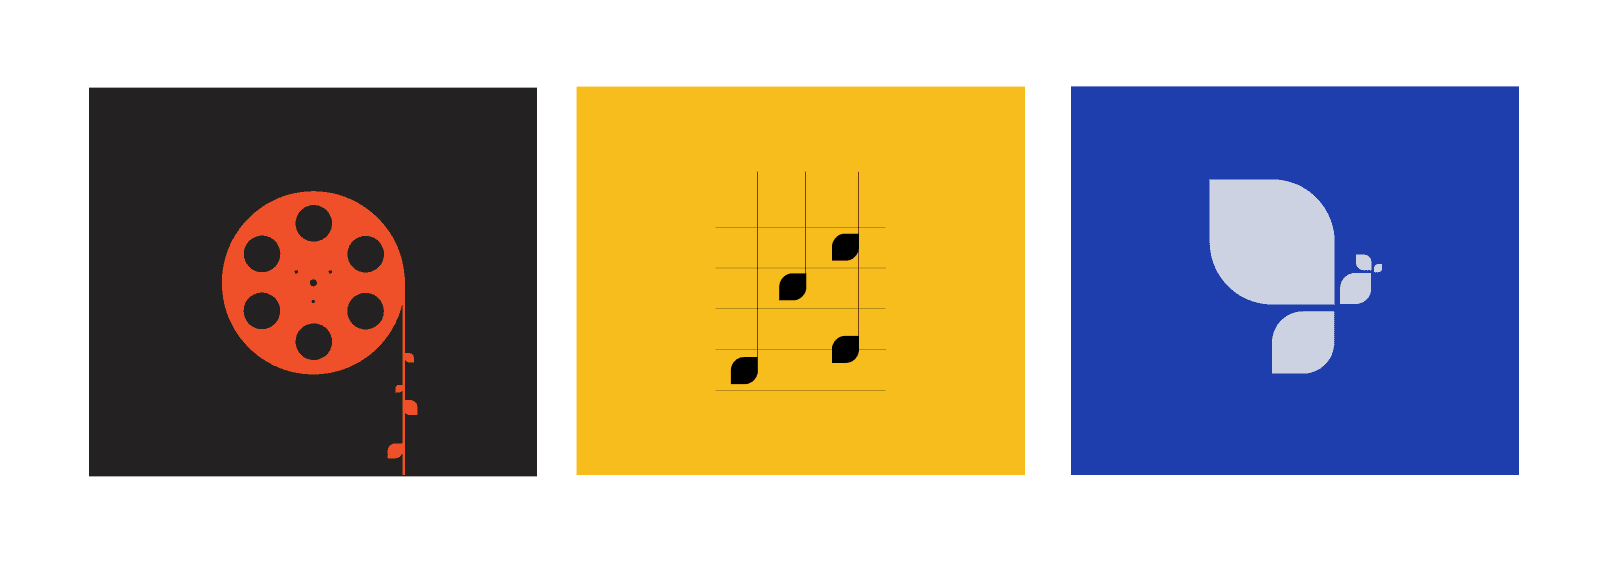
Previously, each event's sublogo echoed the original logo, leading to confusion. I created unique logos for each event, giving them stronger identities while using shapes from the original logo for consistency.

Colors

Colors

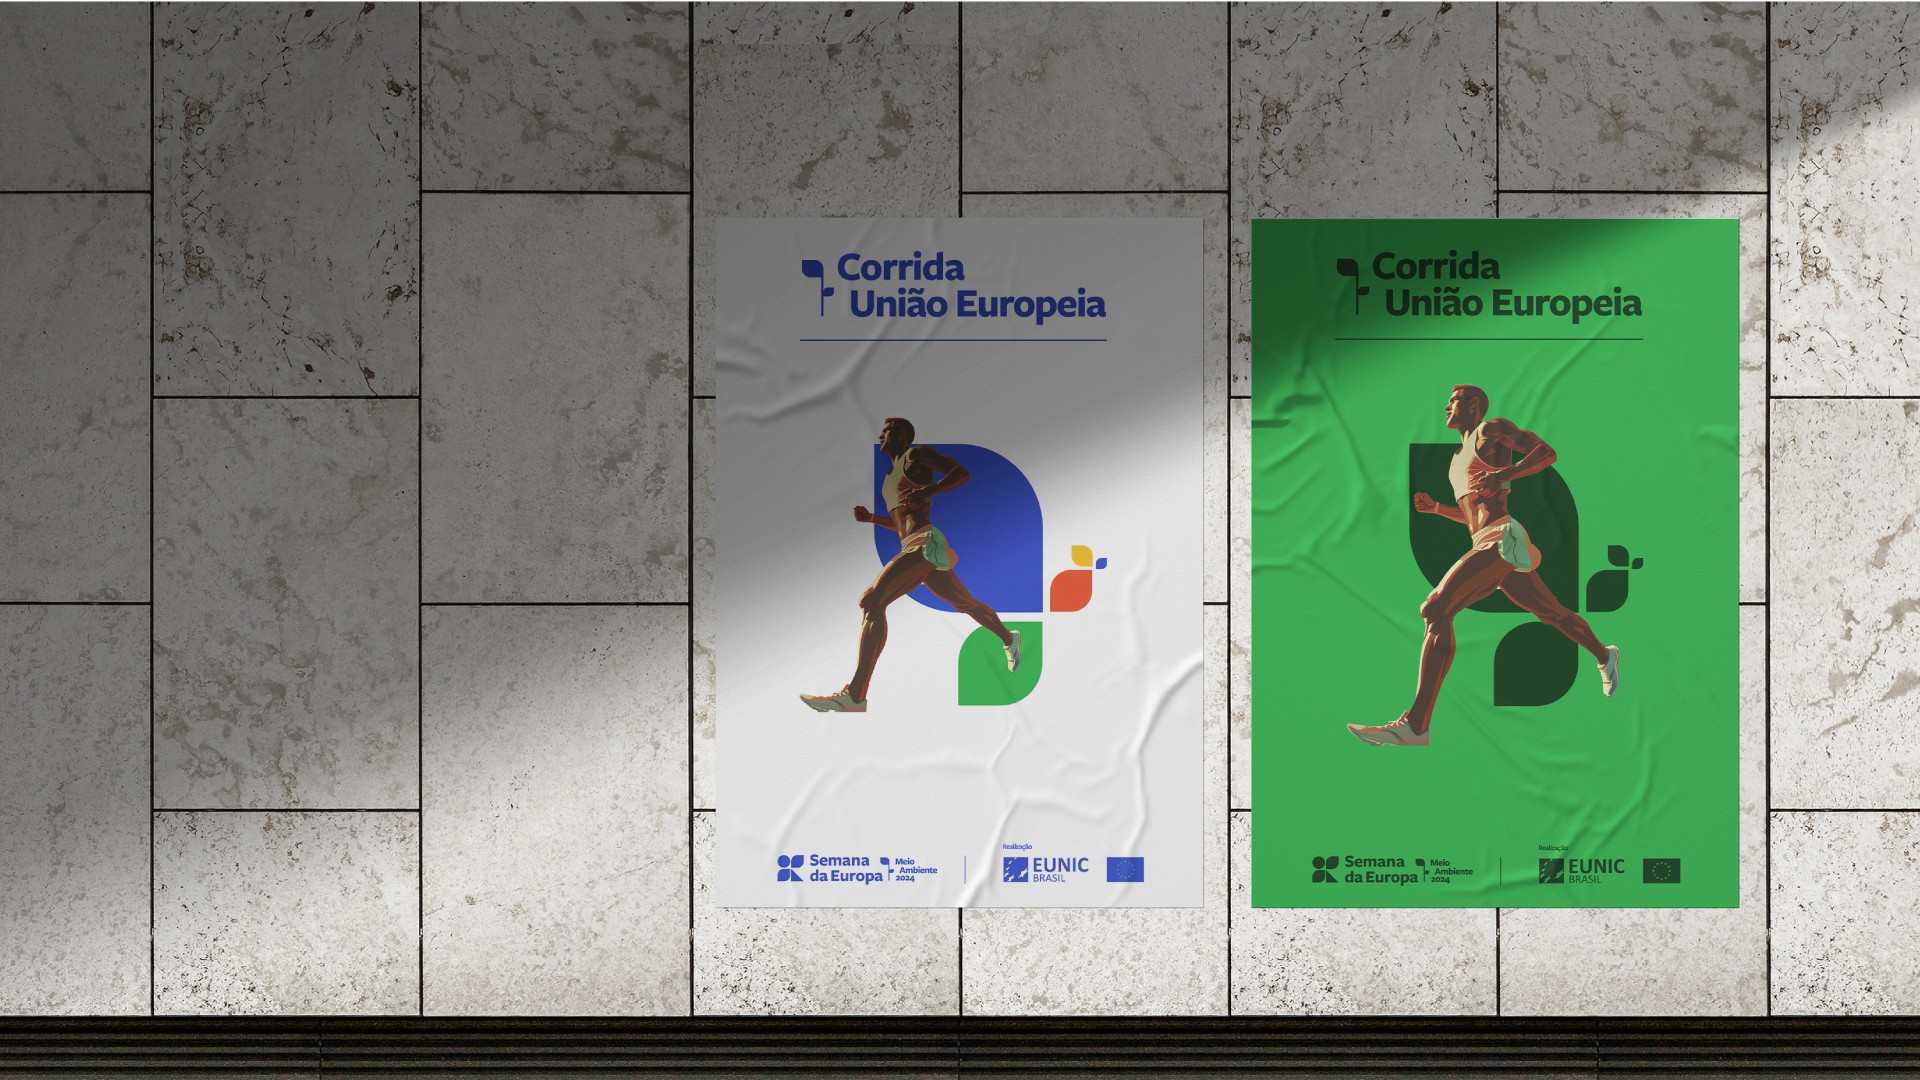
The colors were largely predefined, but I made adjustments to brighten them, added shades, and refined the tones to create a more cohesive and visually appealing palette. This enhances the overall design, making it more vibrant and engaging.

Website

Website

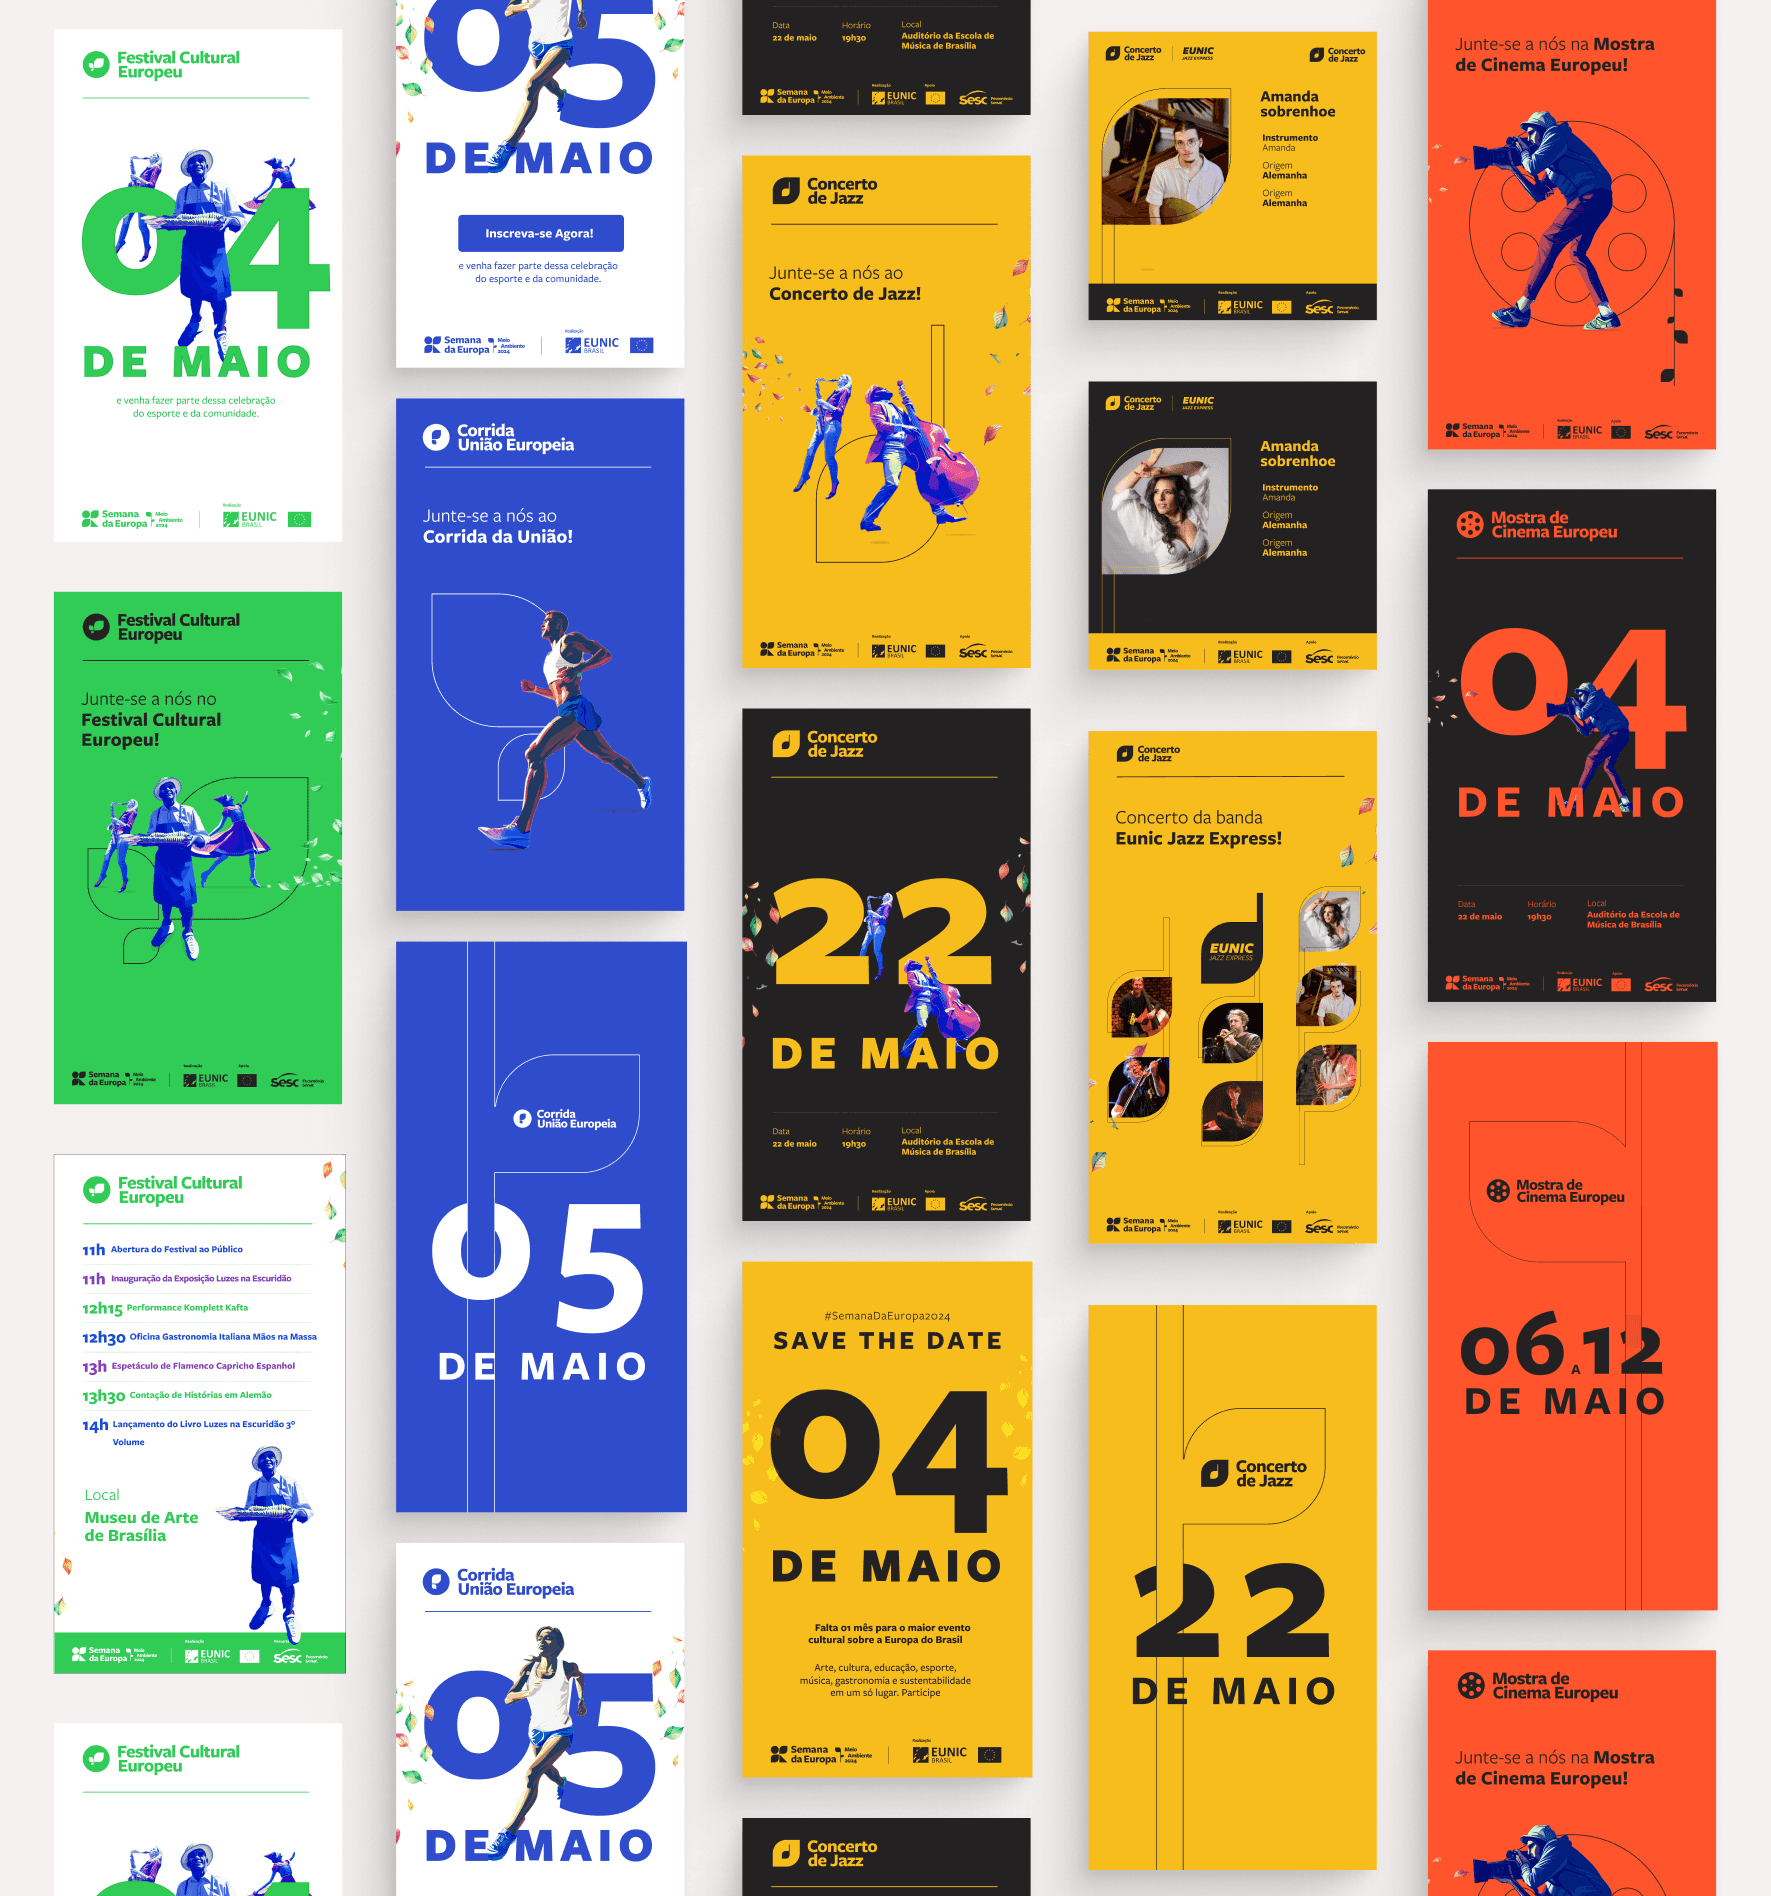
Social Media post templates

Social Media post templates

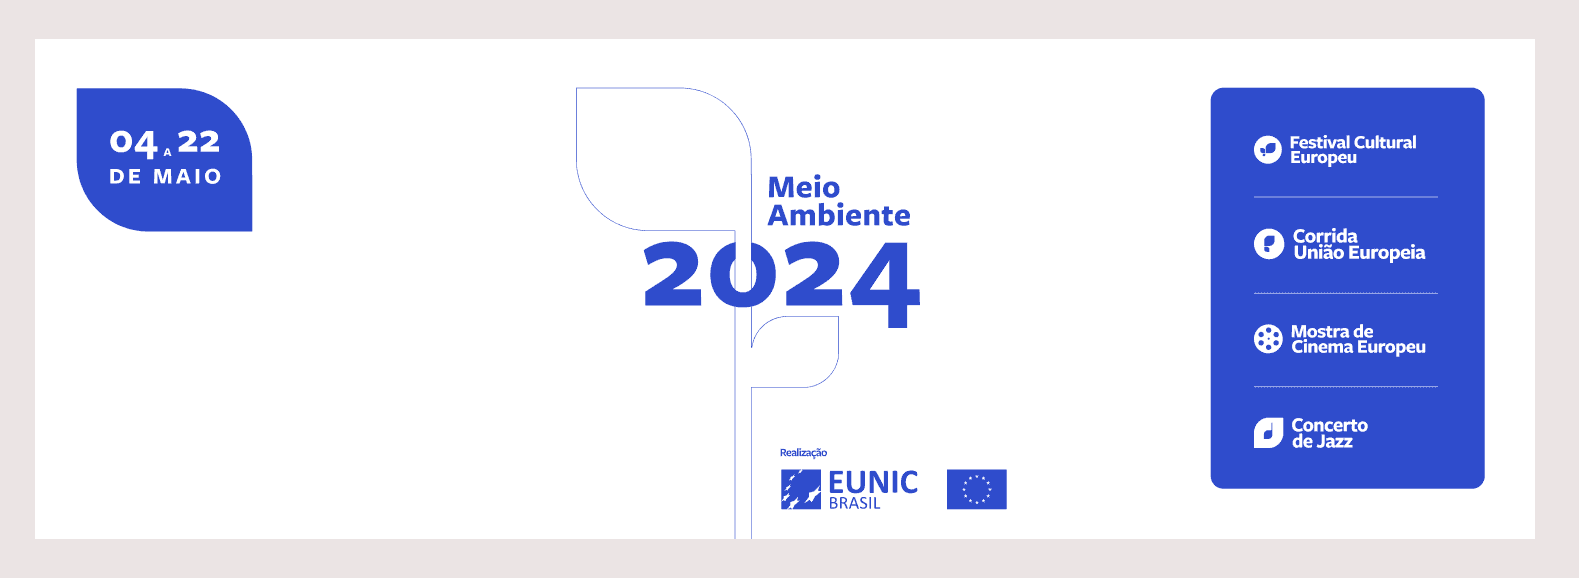
Social Media top banners

Social Media top banners

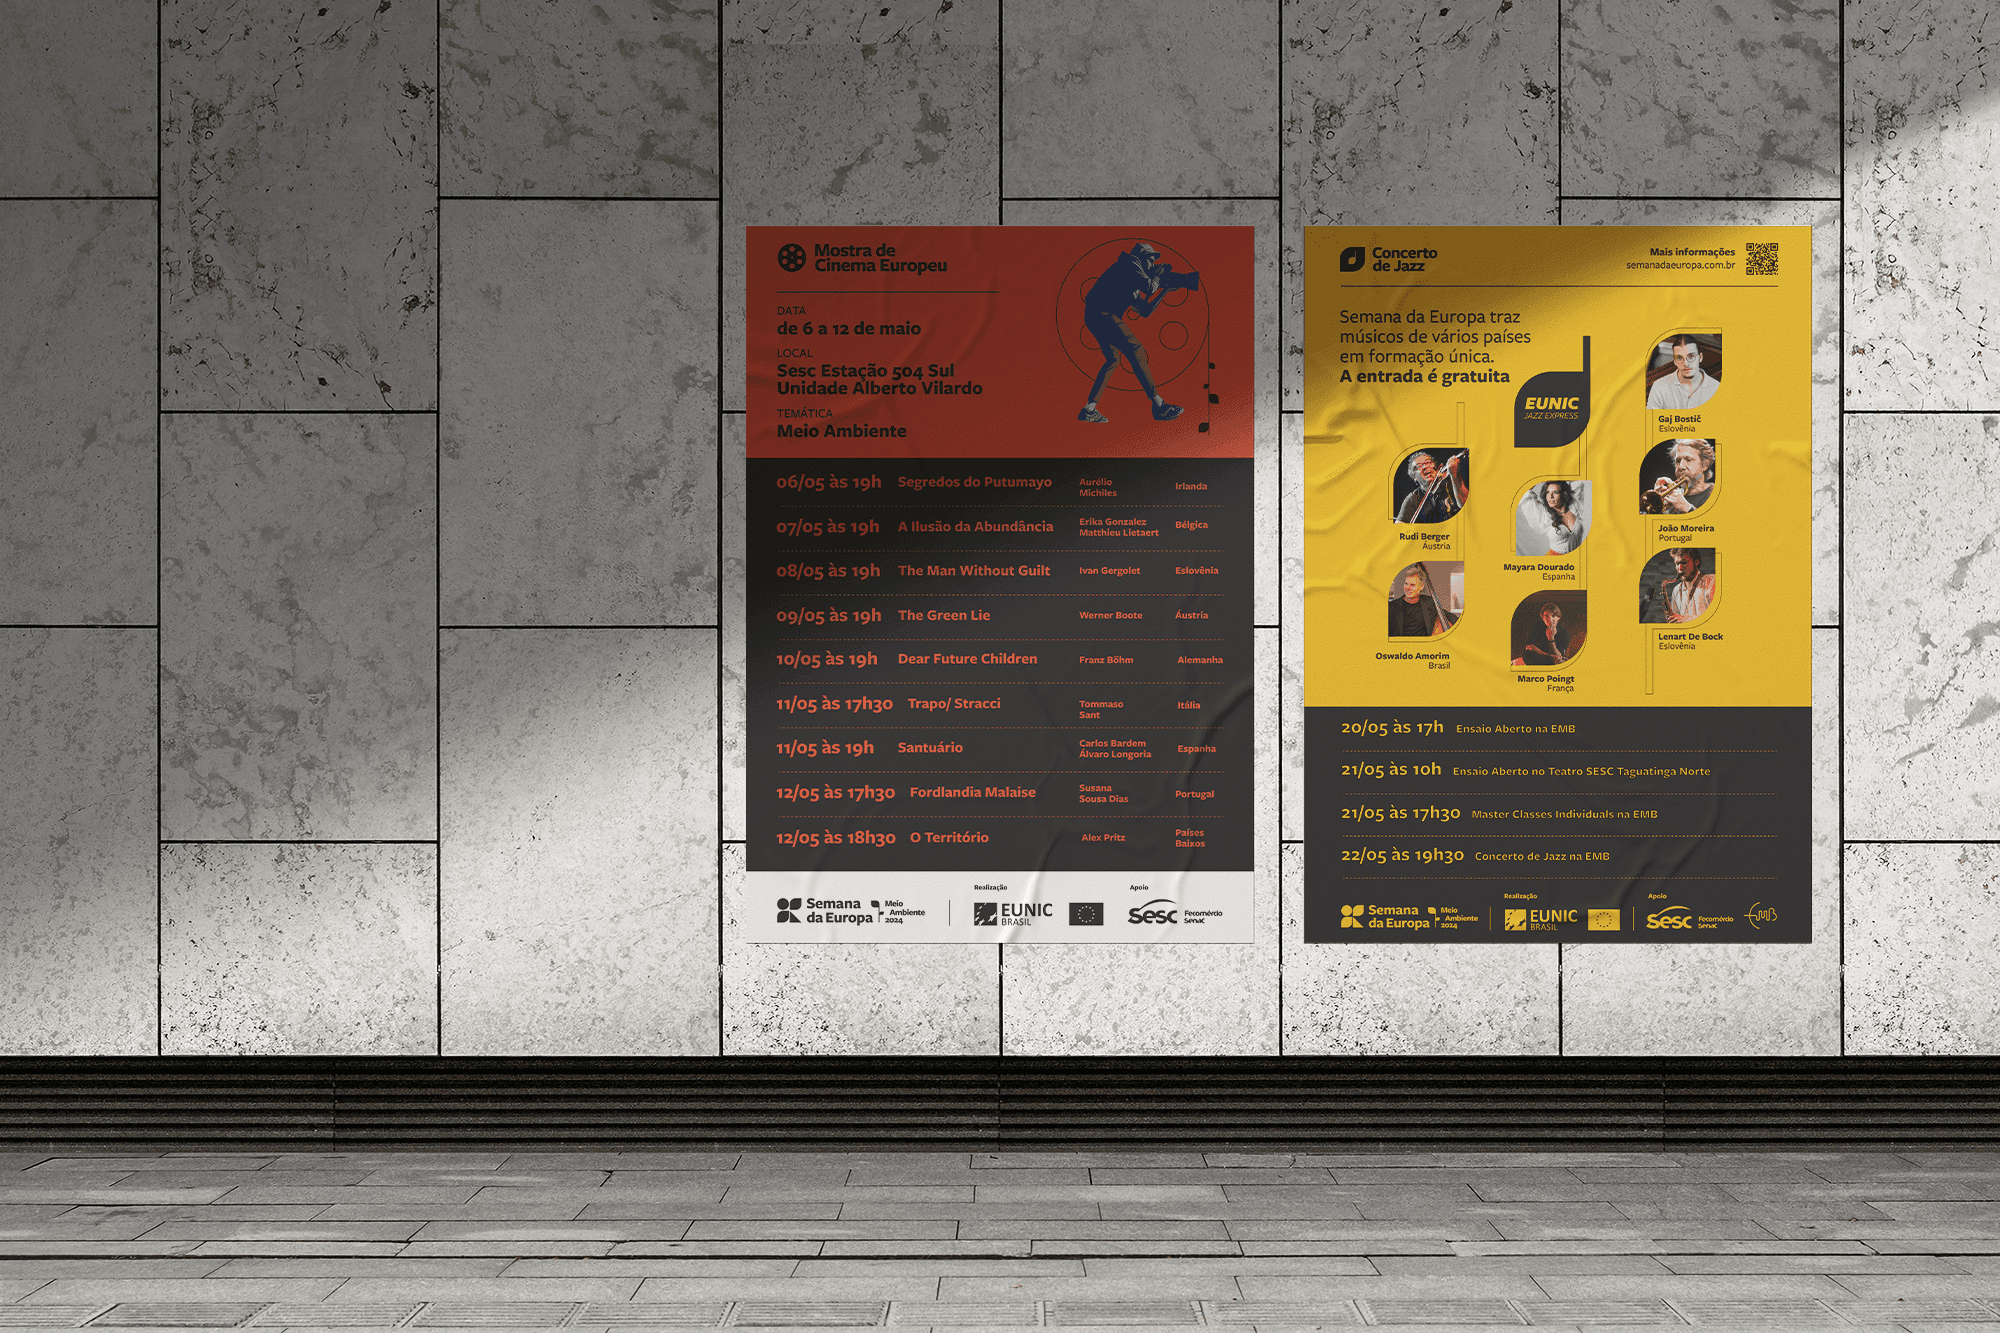
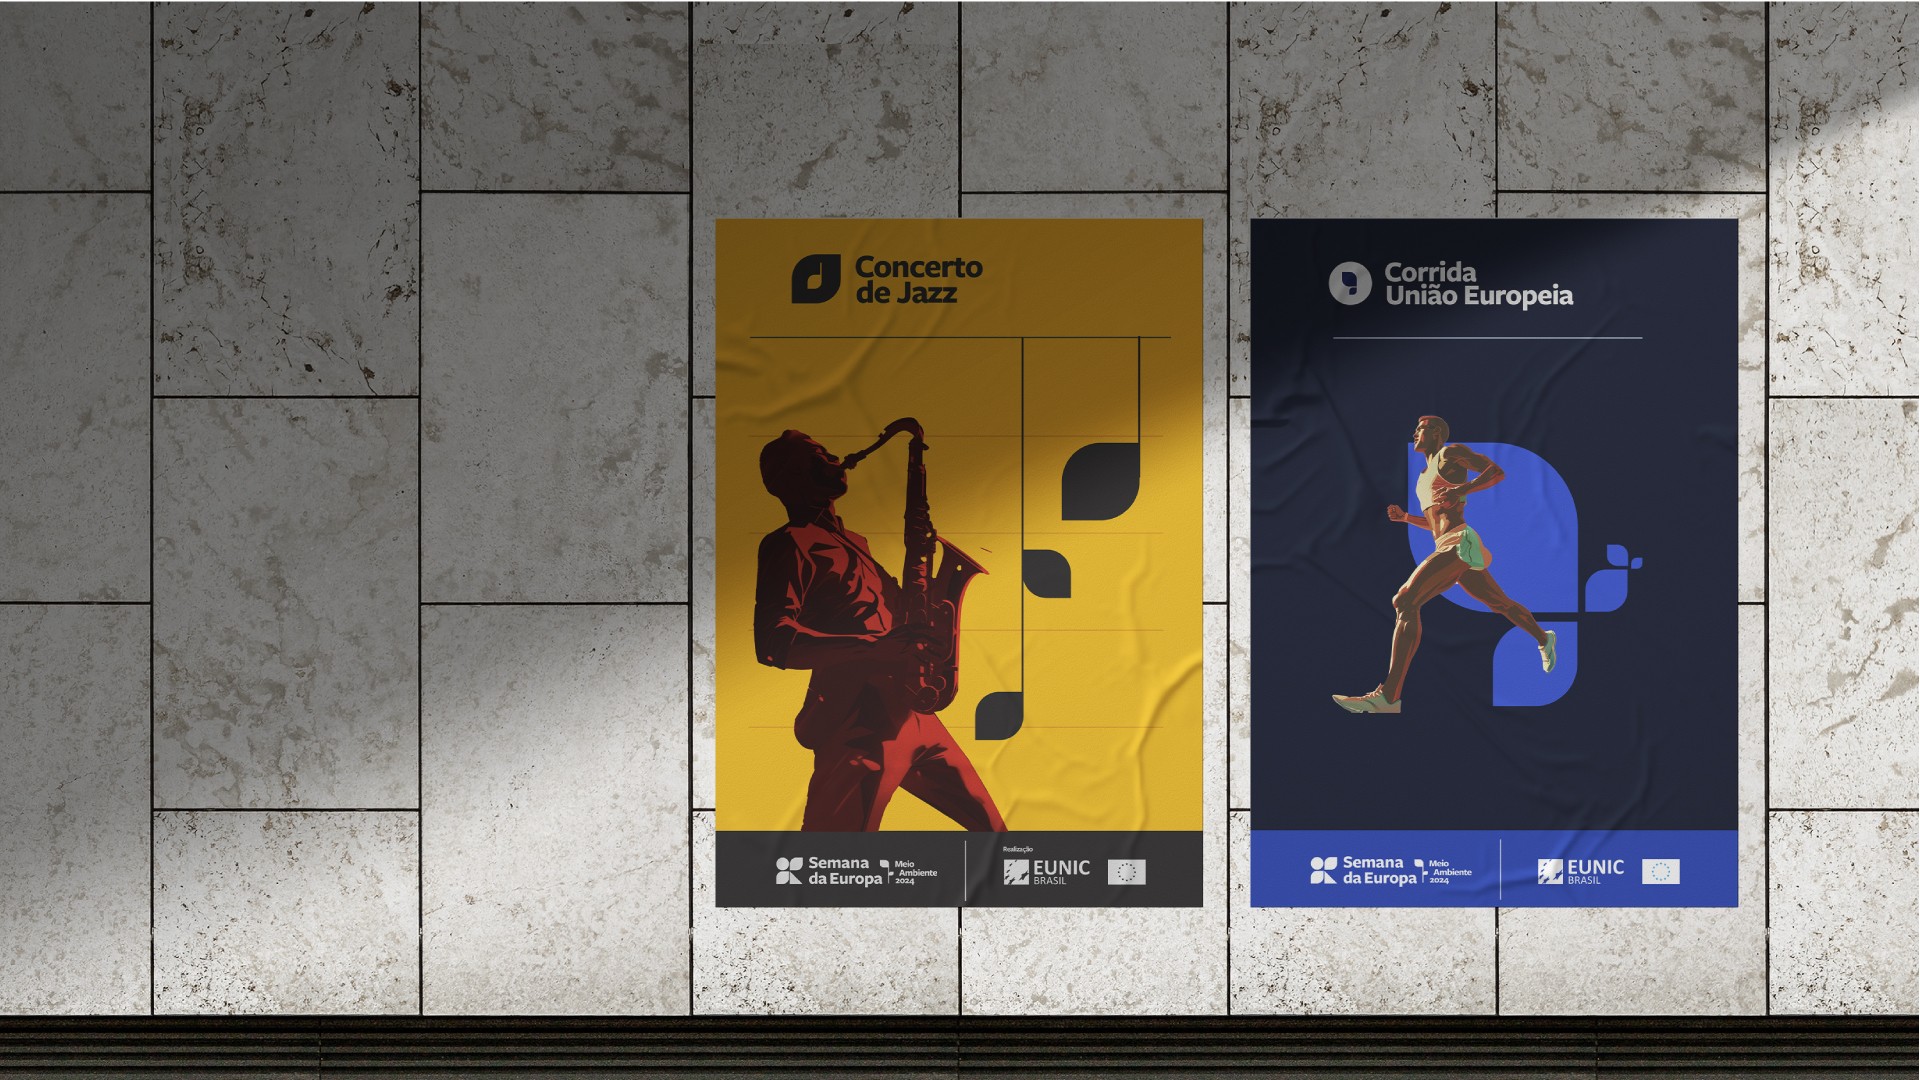
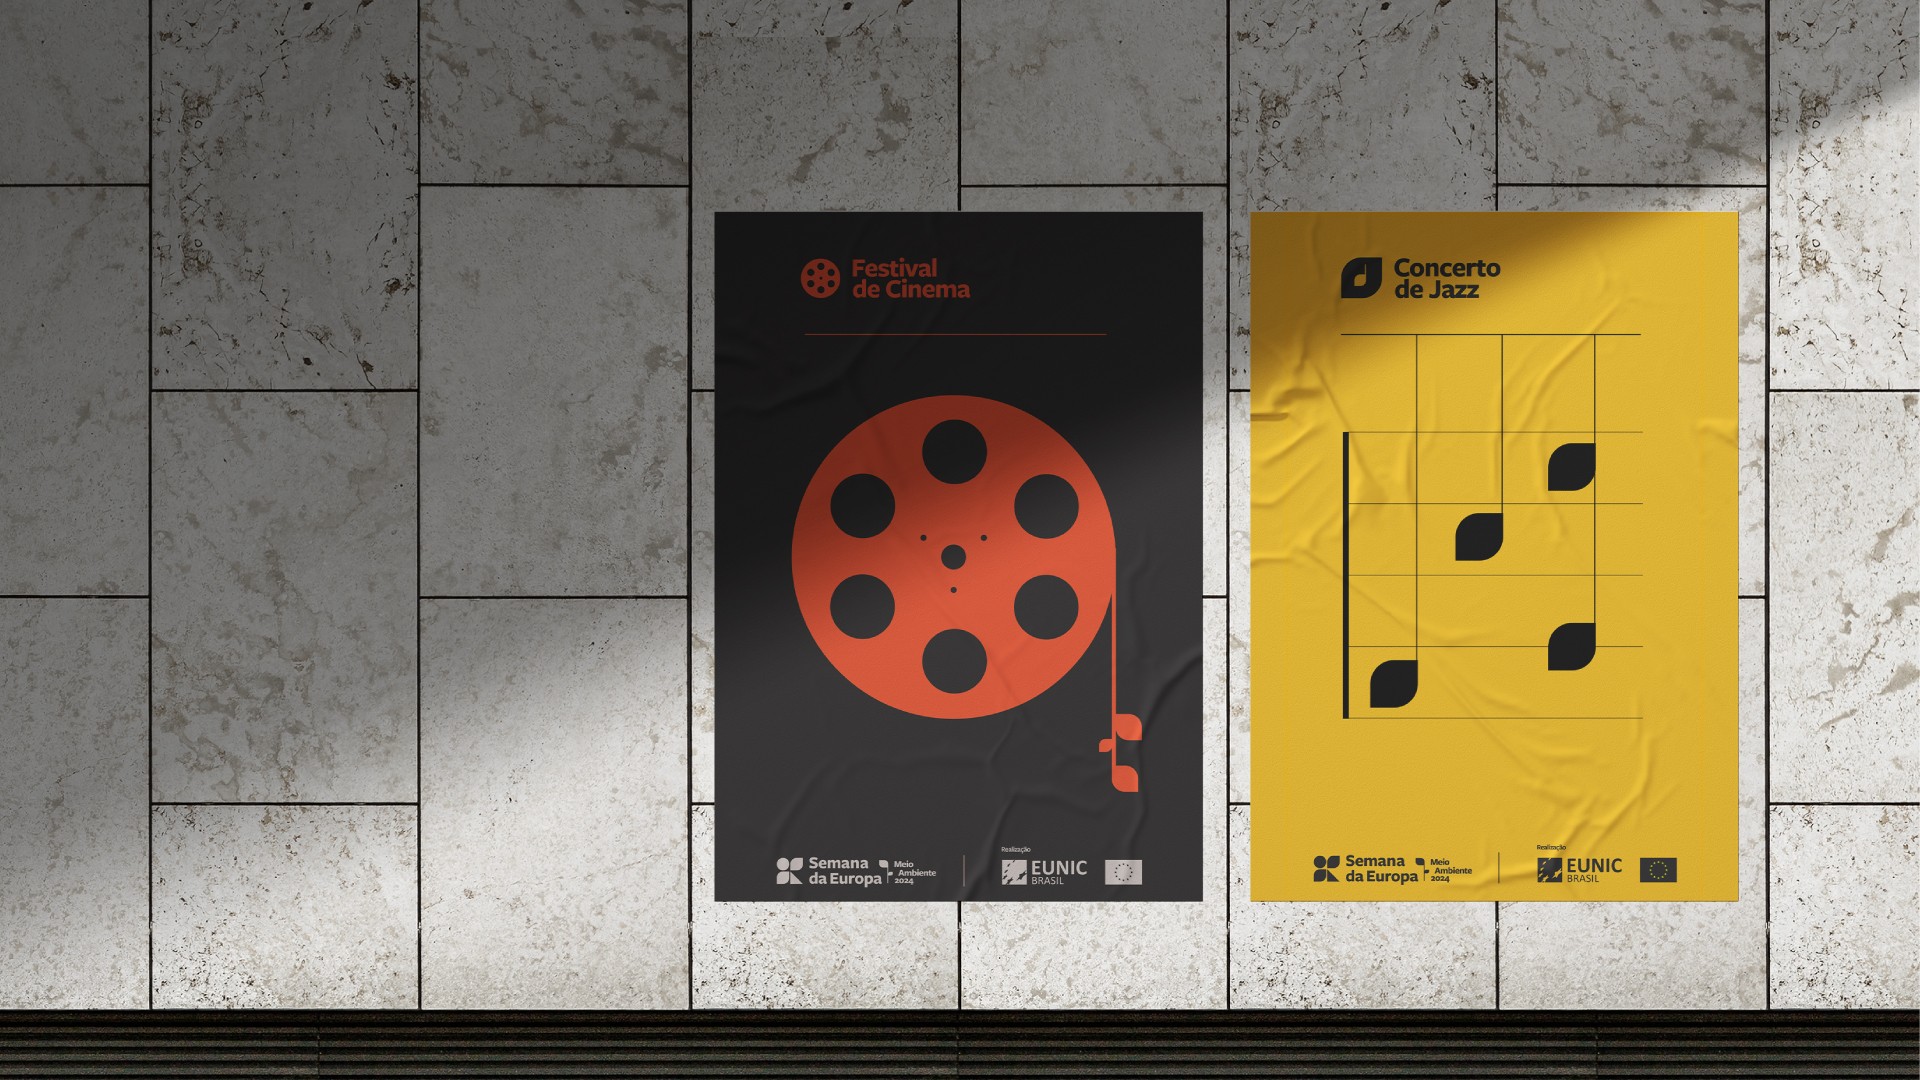
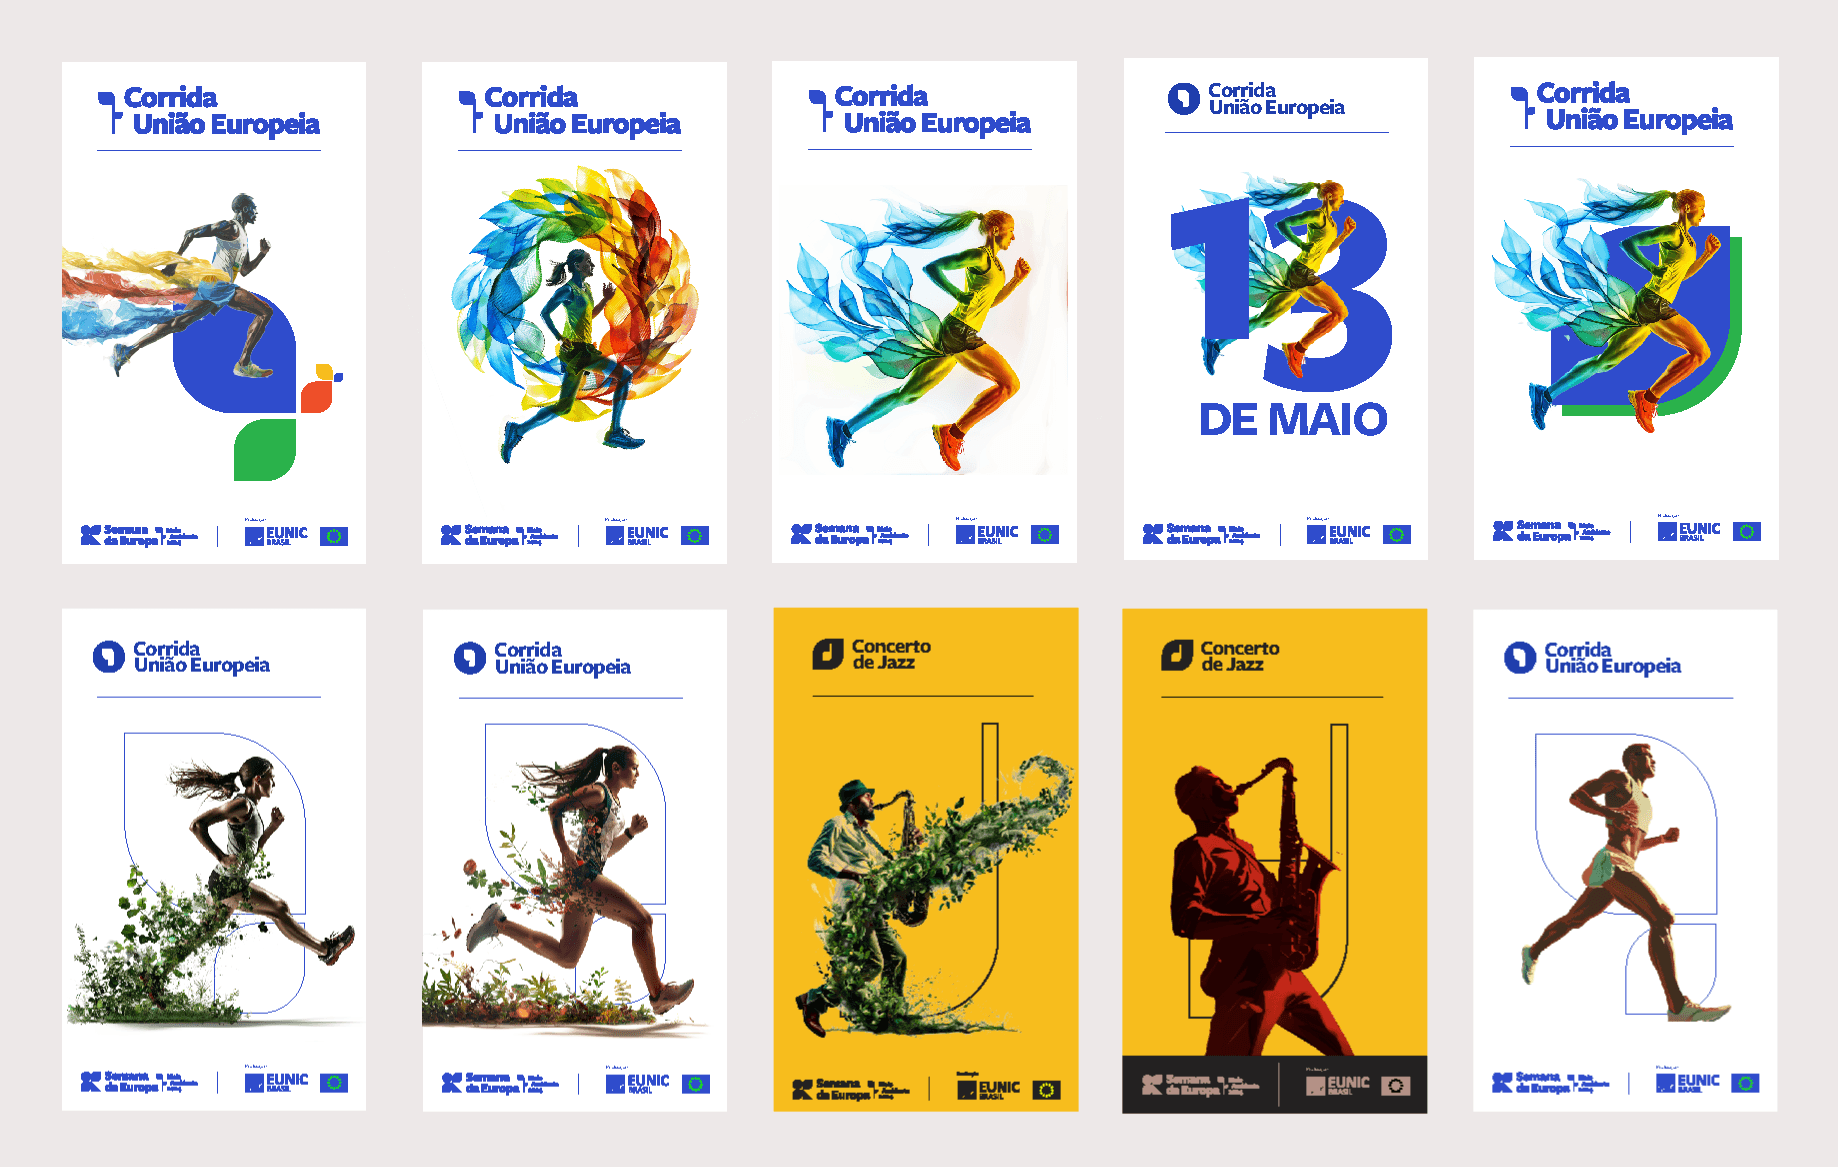
Posters

Posters

Event Design

Event Design

Understanding Data and Behavior

In collaboration with PMs, I analyzed the data and watched hours of Hotjar videos trying to understand what was driving the bounce rate of the previous calculator to be so high. I learned that searching engines were leading users to the wrong calculators. People were confused about the features of specific calculators. So they would switch between them. Finally, calculators were confusing, difficult to use, and hard to understand the results.

Data and User Behavior

In collaboration with PMs, I analyzed the data and watched hours of Hotjar videos trying to understand what was driving the bounce rate of the previous calculator to be so high. I learned that searching engines were leading users to the wrong calculators. People were confused about the features of specific calculators. So they would switch between them. Finally, calculators were confusing, difficult to use, and hard to understand the results.

More about the process

More about the process

Data and User Behavior

Logo

Logo

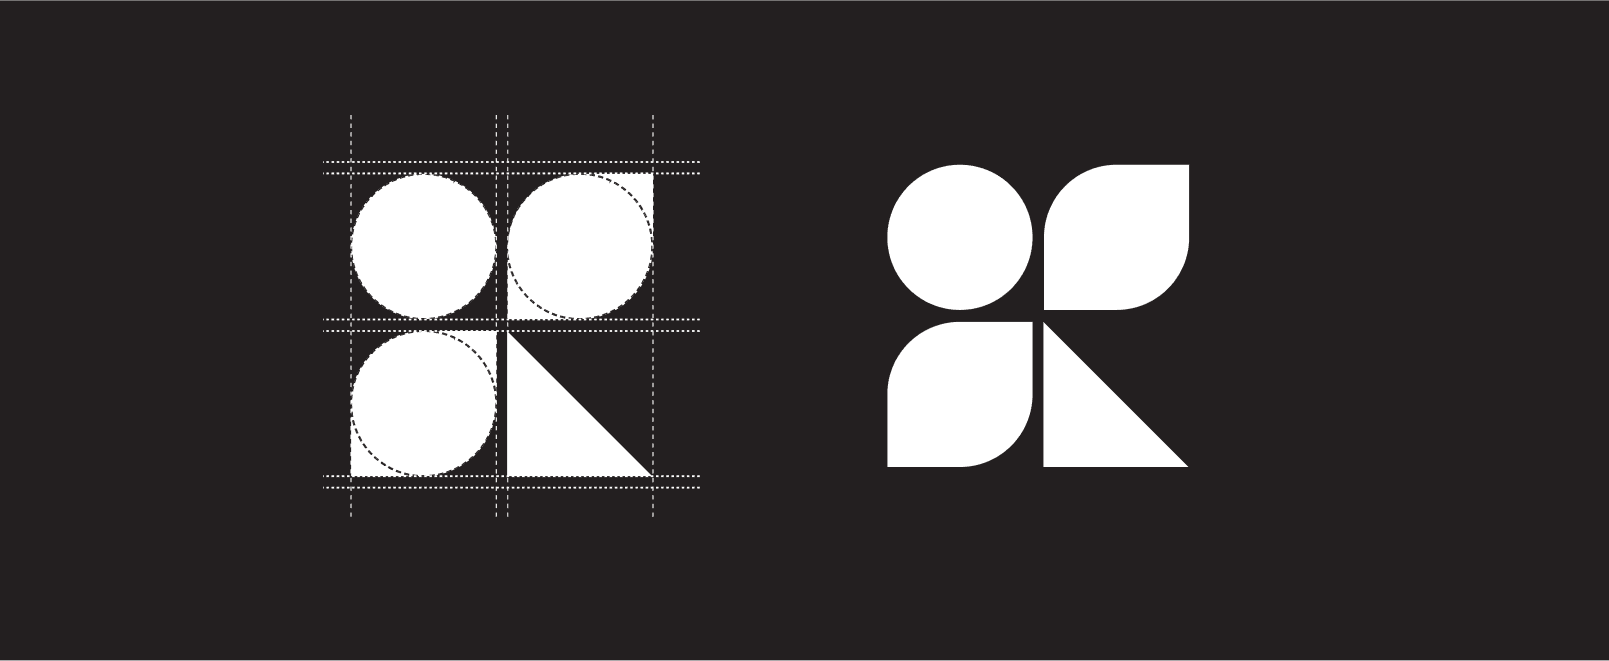
I Refined the previous logo mark to make it more balanced

Symbols

Symbols

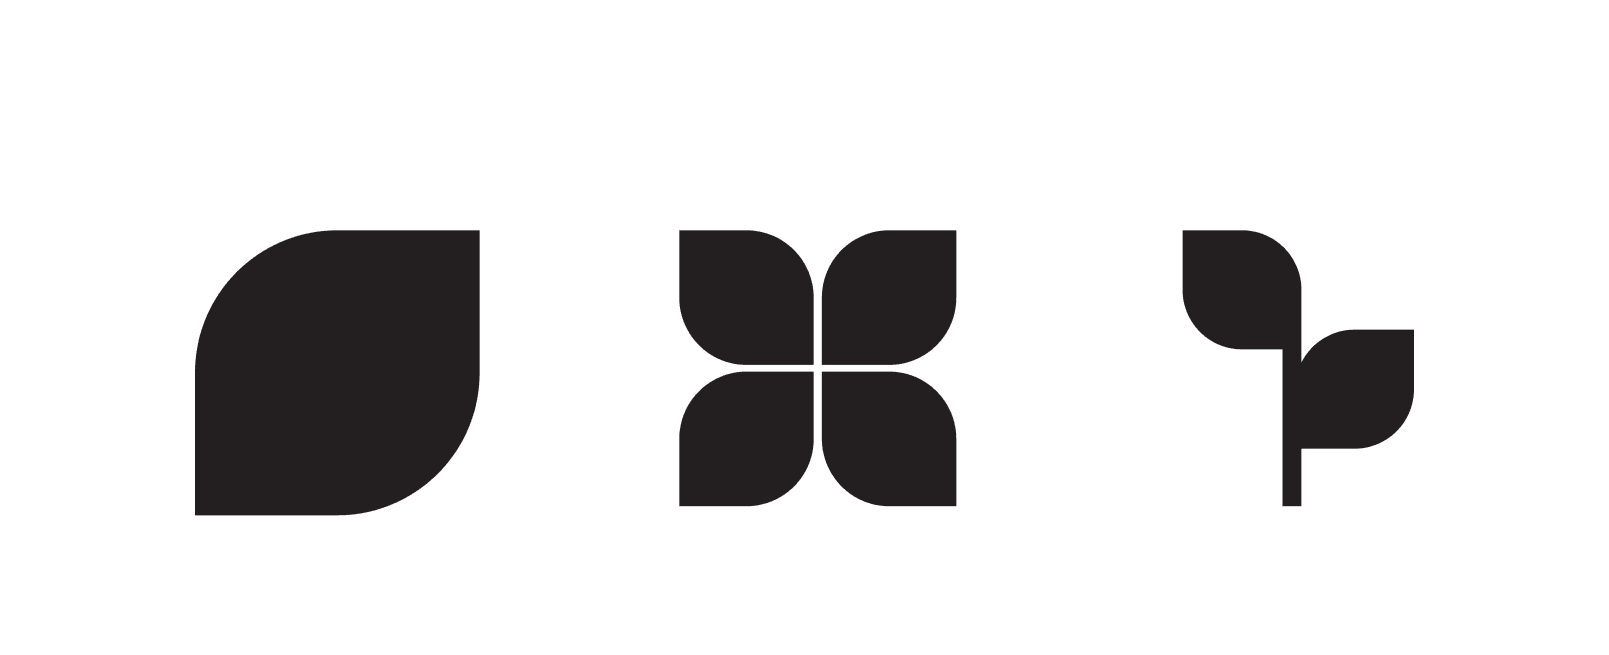
I used all the basic shapes from the original logo to create the sublogos and symbols for the entire visual identity. This approach ensures consistency and a cohesive look while giving each event its own distinct personality.
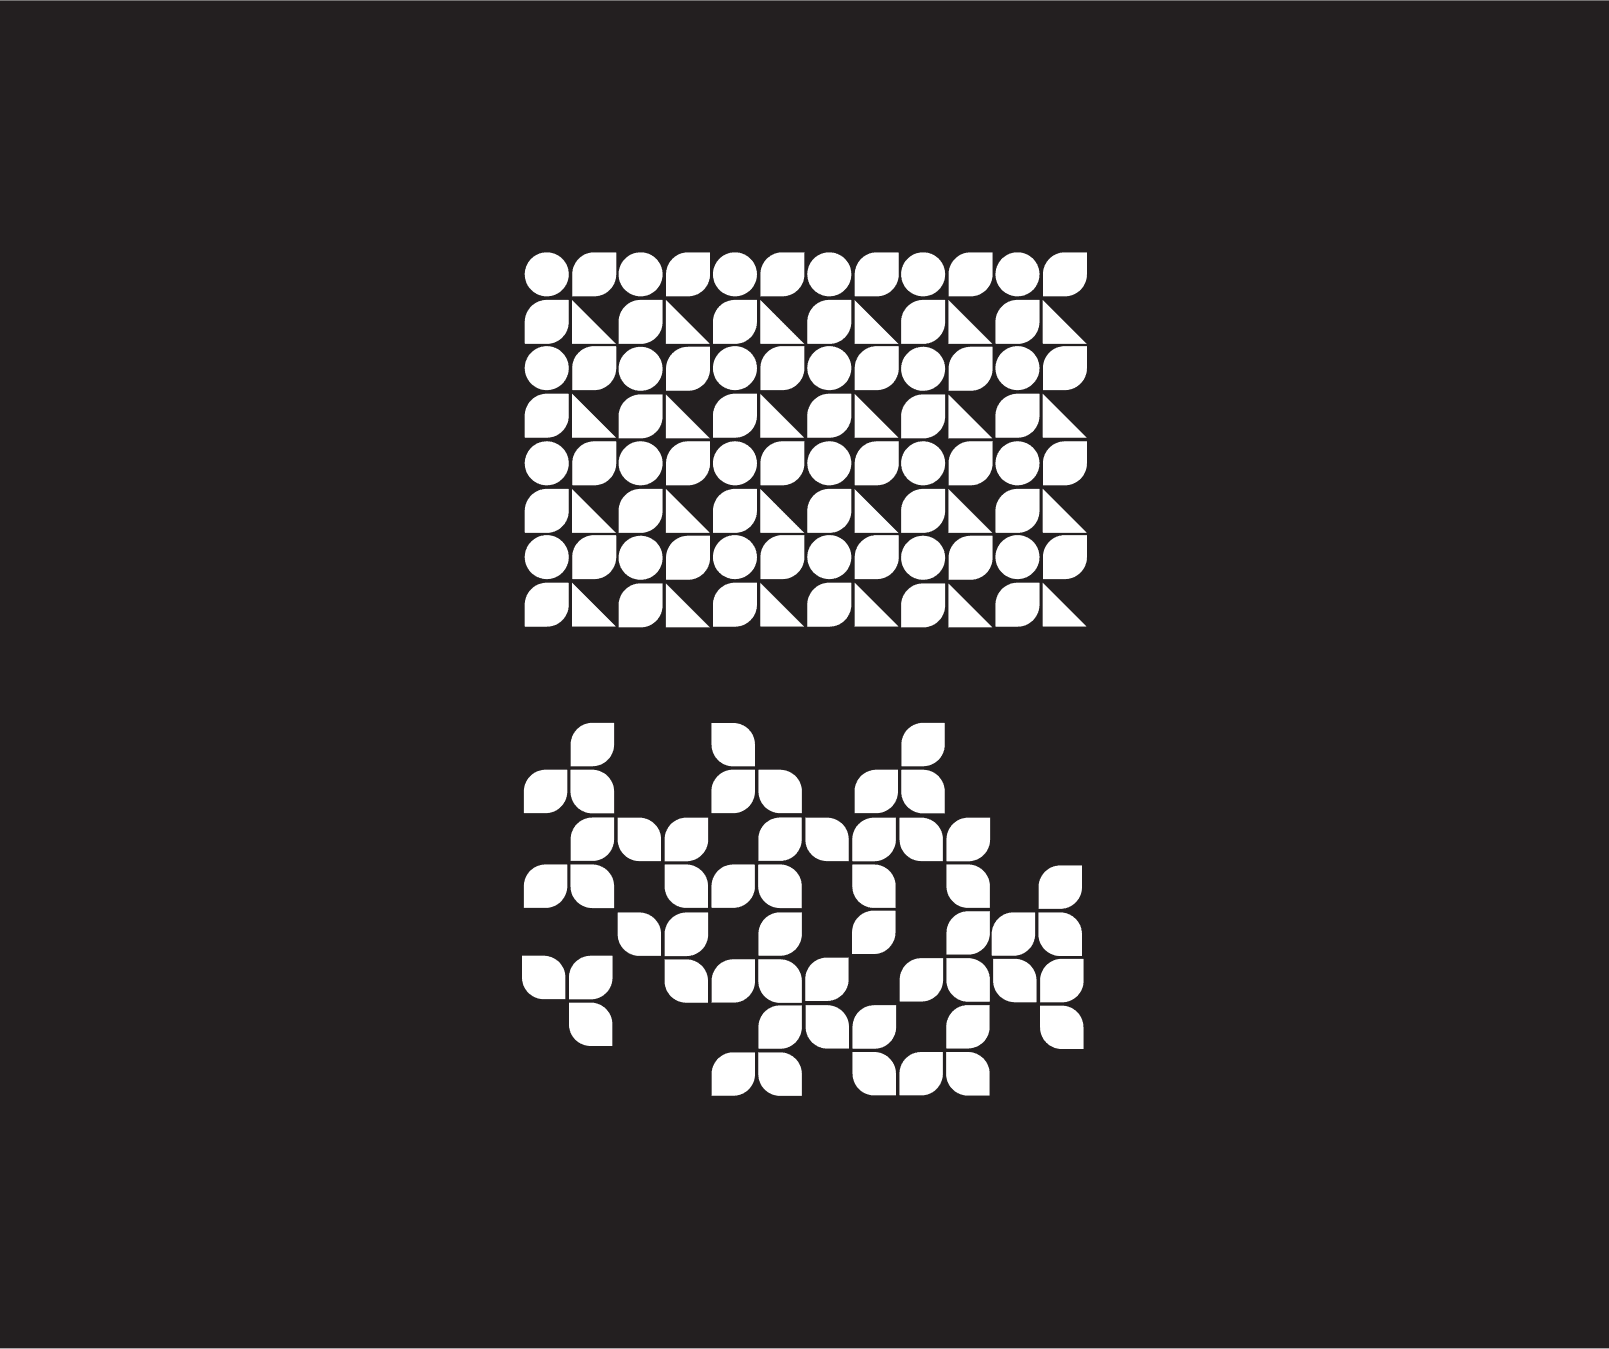
Patterns

Patterns

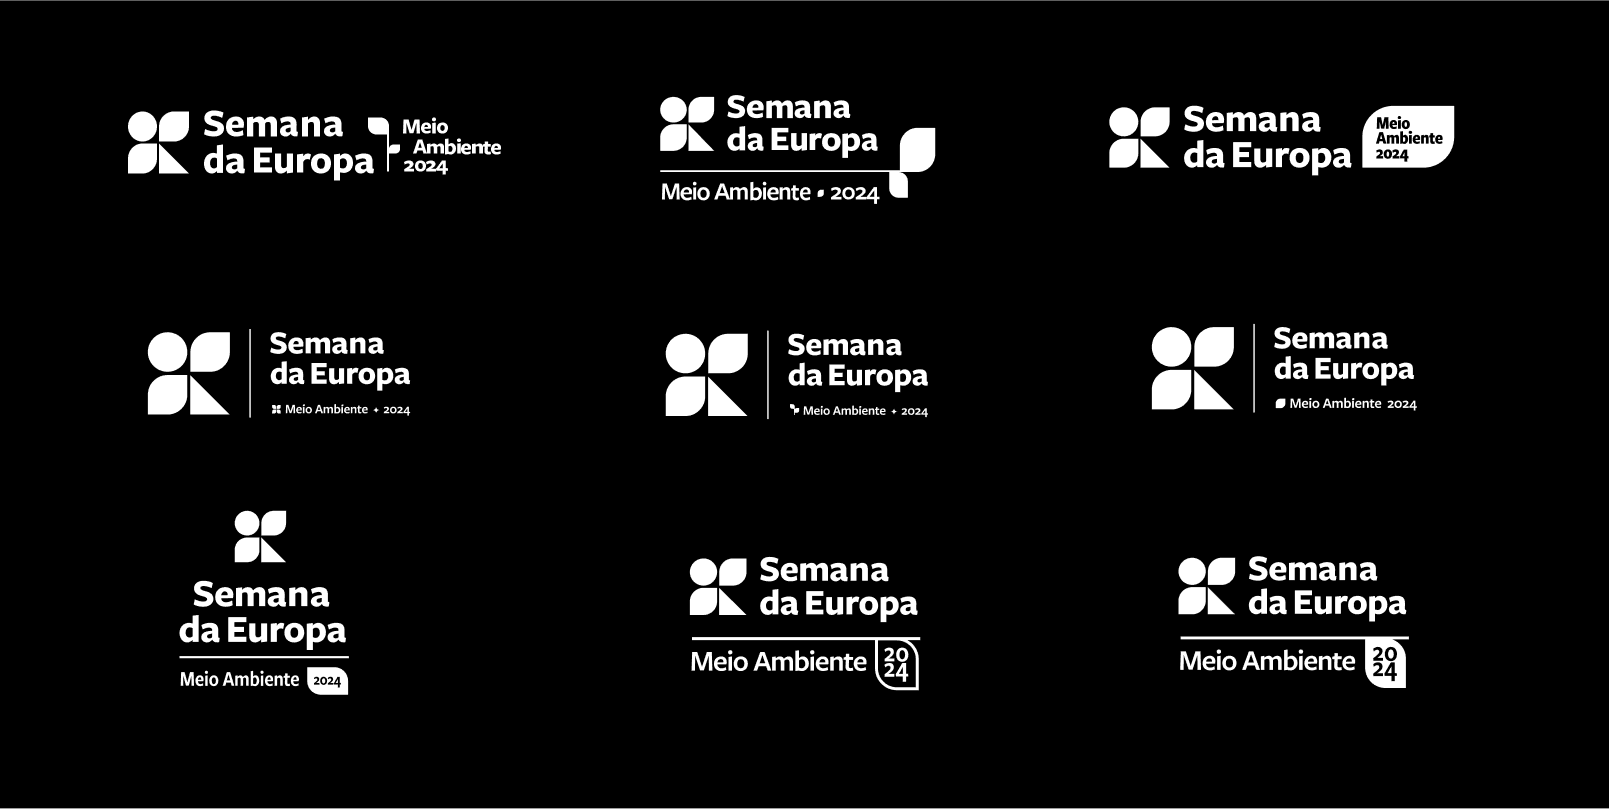
Other logos options presented

Other logos options presented

Proportions

Proportions

Sublogos

Sublogos

Early explorations

Early explorations

Explorating concepts on posters and posts

Explorating concepts on posters and posts

Raphael Socrates

Lives in New York, NY

email: raphaelsocrates@gmail.com

Logo

Raphael Socrates

Lives in New York, NY

email: raphaelsocrates@gmail.com

Logo

Raphael Socrates

Lives in New York, NY

email: raphaelsocrates@gmail.com

Logo